29
/
en
AIzaSyAYiBZKx7MnpbEhh9jyipgxe19OcubqV5w
April 1, 2024
141617
Greece
GRC
true
2
1
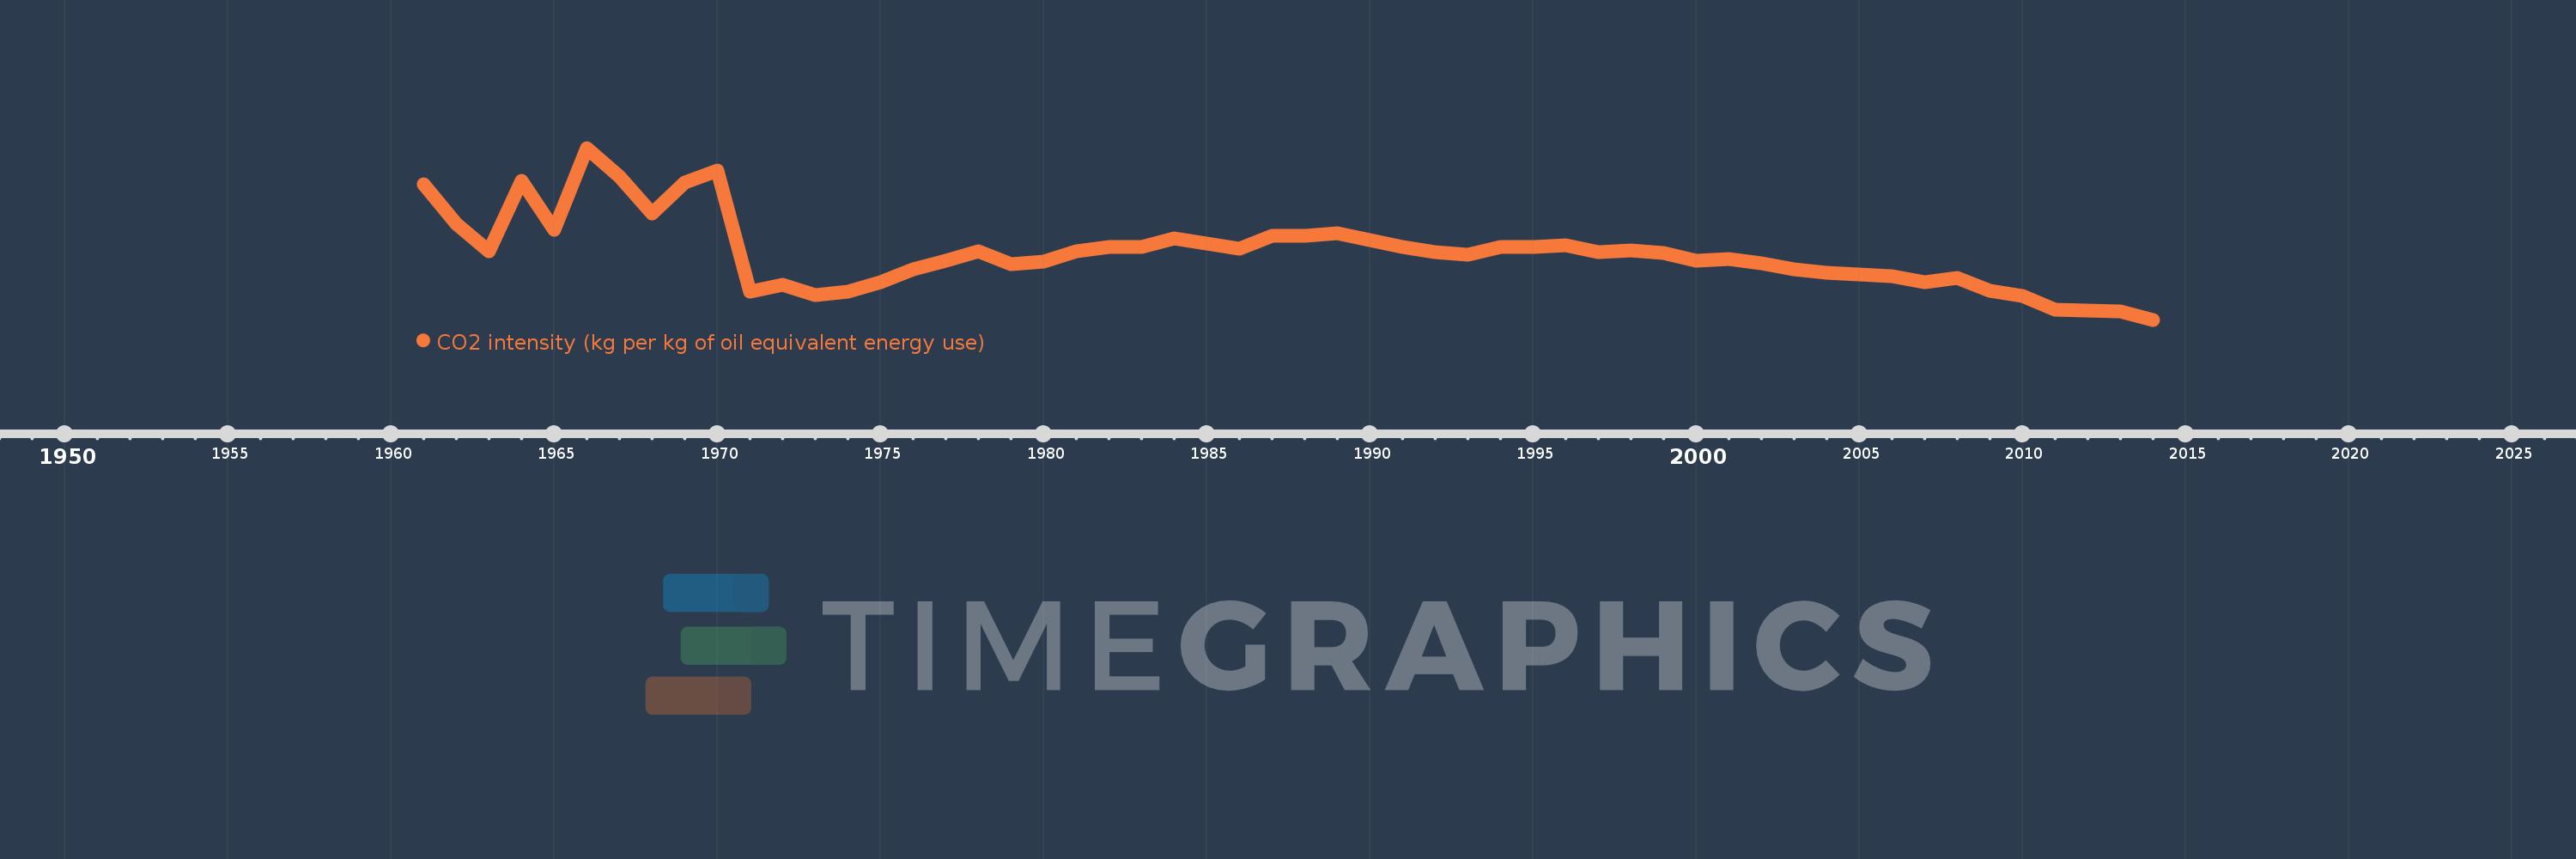
CO2 intensity (kg per kg of oil equivalent energy use)
2014,2013,2012,2011,2010,2009,2008,2007,2006,2005,2004,2003,2002,2001,2000,1999,1998,1997,1996,1995,1994,1993,1992,1991,1990,1989,1988,1987,1986,1985,1984,1983,1982,1981,1980,1979,1978,1977,1976,1975,1974,1973,1972,1971,1970,1969,1968,1967,1966,1965,1964,1963,1962,1961
This statistics in other country:
AlbaniaAlgeriaAngolaAntigua and BarbudaArab WorldArgentinaArmeniaAustraliaAustriaAzerbaijanBahamas, TheBahrainBangladeshBarbadosBelarusBelgiumBelizeBeninBhutanBoliviaBosnia and HerzegovinaBotswanaBrazilBrunei DarussalamBulgariaCabo VerdeCambodiaCameroonCanadaCaribbean small statesCentral Europe and the BalticsChileChinaColombiaComorosCongo, Dem. Rep.Congo, Rep.Costa RicaCote d'IvoireCroatiaCubaCuracaoCyprusCzech RepublicDenmarkDjiboutiDominicaDominican RepublicEarly-demographic dividendEast Asia & PacificEast Asia & Pacific (excluding high income)East Asia & Pacific (IDA & IBRD countries)EcuadorEgypt, Arab Rep.El SalvadorEquatorial GuineaEritreaEstoniaEthiopiaEuro areaEurope & Central AsiaEurope & Central Asia (excluding high income)Europe & Central Asia (IDA & IBRD countries)European UnionFijiFinlandFragile and conflict affected situationsFranceGabonGambia, TheGeorgiaGermanyGhanaGibraltarGreeceGrenadaGuatemalaGuinea-BissauGuyanaHaitiHeavily indebted poor countries (HIPC)High incomeHondurasHong Kong SAR, ChinaHungaryIBRD onlyIcelandIDA & IBRD totalIDA blendIDA onlyIDA totalIndiaIndonesiaIran, Islamic Rep.IraqIrelandIsraelItalyJamaicaJapanJordanKazakhstanKenyaKiribatiKorea, Dem. People’s Rep.Korea, Rep.KuwaitKyrgyz RepublicLate-demographic dividendLatin America & Caribbean Latin America & Caribbean (excluding high income)Latin America & the Caribbean (IDA & IBRD countries)LatviaLeast developed countries: UN classificationLebanonLesothoLibyaLithuaniaLow & middle incomeLow incomeLower middle incomeLuxembourgMacedonia, FYRMalaysiaMaldivesMaltaMarshall IslandsMauritiusMexicoMiddle East & North AfricaMiddle East & North Africa (excluding high income)Middle East & North Africa (IDA & IBRD countries)Middle incomeMoldovaMongoliaMontenegroMoroccoMozambiqueMyanmarNamibiaNepalNetherlandsNew ZealandNicaraguaNigerNigeriaNorth AmericaNorwayOECD membersOmanOther small statesPacific island small statesPakistanPalauPanamaParaguayPeruPhilippinesPolandPortugalPost-demographic dividendPre-demographic dividendQatarRomaniaRussian FederationSamoaSao Tome and PrincipeSaudi ArabiaSenegalSerbiaSeychellesSingaporeSlovak RepublicSloveniaSmall statesSolomon IslandsSouth AfricaSouth AsiaSouth Asia (IDA & IBRD)South SudanSpainSri LankaSt. Kitts and NevisSt. LuciaSt. Vincent and the GrenadinesSub-Saharan Africa Sub-Saharan Africa (excluding high income)Sub-Saharan Africa (IDA & IBRD countries)SudanSurinameSwazilandSwedenSwitzerlandSyrian Arab RepublicTajikistanTanzaniaThailandTimor-LesteTogoTongaTrinidad and TobagoTunisiaTurkeyTurkmenistanUkraineUnited Arab EmiratesUnited KingdomUnited StatesUpper middle incomeUruguayUzbekistanVanuatuVenezuela, RBVietnamWorldYemen, Rep.ZambiaZimbabwe Timeline:
This timeline shows a graph from 1961 to 2014 of Greece. No data until 1960. Number of actual observations by date: 54.
Source name:
World Development Indicators
Source organization:
Carbon Dioxide Information Analysis Center, Environmental Sciences Division, Oak Ridge National Laboratory, Tennessee, United States.
Categories, topics:
Climate Change, Environment
Last updated:
apr 23, 2017
Indicators value changes by year
At the date of observation
Value
Absolute change
Change from previous value
jan 1, 1961
3.906
+3.906
0.0%
jan 1, 1962
3.627
-0.278
-7.12%
jan 1, 1963
3.437
-0.191
-5.25%
jan 1, 1964
3.93
+0.494
14.37%
jan 1, 1965
3.584
-0.347
-8.82%
jan 1, 1966
4.159
+0.575
16.06%
jan 1, 1967
3.957
-0.202
-4.86%
jan 1, 1968
3.702
-0.255
-6.45%
jan 1, 1969
3.916
+0.215
5.8%
jan 1, 1970
4.002
+0.086
2.2%
jan 1, 1971
3.149
-0.853
-21.32%
jan 1, 1972
3.201
+0.052
1.64%
jan 1, 1973
3.13
-0.071
-2.2%
jan 1, 1974
3.154
+0.024
0.77%
jan 1, 1975
3.217
+0.062
1.98%
jan 1, 1976
3.31
+0.093
2.9%
jan 1, 1977
3.369
+0.059
1.79%
jan 1, 1978
3.436
+0.066
1.97%
jan 1, 1979
3.343
-0.093
-2.72%
jan 1, 1980
3.362
+0.019
0.58%
jan 1, 1981
3.433
+0.071
2.11%
jan 1, 1982
3.463
+0.031
0.89%
jan 1, 1983
3.465
+0.002
0.05%
jan 1, 1984
3.528
+0.062
1.8%
jan 1, 1985
3.489
-0.039
-1.11%
jan 1, 1986
3.453
-0.036
-1.03%
jan 1, 1987
3.544
+0.092
2.65%
jan 1, 1988
3.542
-0.002
-0.06%
jan 1, 1989
3.56
+0.018
0.5%
jan 1, 1990
3.513
-0.047
-1.32%
jan 1, 1991
3.464
-0.048
-1.38%
jan 1, 1992
3.426
-0.038
-1.1%
jan 1, 1993
3.409
-0.017
-0.51%
jan 1, 1994
3.462
+0.053
1.56%
jan 1, 1995
3.466
+0.004
0.11%
jan 1, 1996
3.474
+0.008
0.23%
jan 1, 1997
3.429
-0.045
-1.31%
jan 1, 1998
3.441
+0.012
0.36%
jan 1, 1999
3.425
-0.016
-0.46%
jan 1, 2000
3.368
-0.057
-1.66%
jan 1, 2001
3.382
+0.014
0.42%
jan 1, 2002
3.35
-0.033
-0.97%
jan 1, 2003
3.307
-0.042
-1.26%
jan 1, 2004
3.286
-0.022
-0.66%
jan 1, 2005
3.271
-0.015
-0.45%
jan 1, 2006
3.262
-0.009
-0.26%
jan 1, 2007
3.219
-0.043
-1.33%
jan 1, 2008
3.251
+0.032
1.01%
jan 1, 2009
3.155
-0.097
-2.97%
jan 1, 2010
3.124
-0.031
-0.99%
jan 1, 2011
3.024
-0.1
-3.19%
jan 1, 2012
3.018
-0.006
-0.21%
jan 1, 2013
3.011
-0.007
-0.23%
jan 1, 2014
2.955
-0.055
-1.84%
Ranking of countries by current statistics by years


Comments: