29
/
en
AIzaSyAYiBZKx7MnpbEhh9jyipgxe19OcubqV5w
April 1, 2024
228238
Romania
ROU
true
2
1
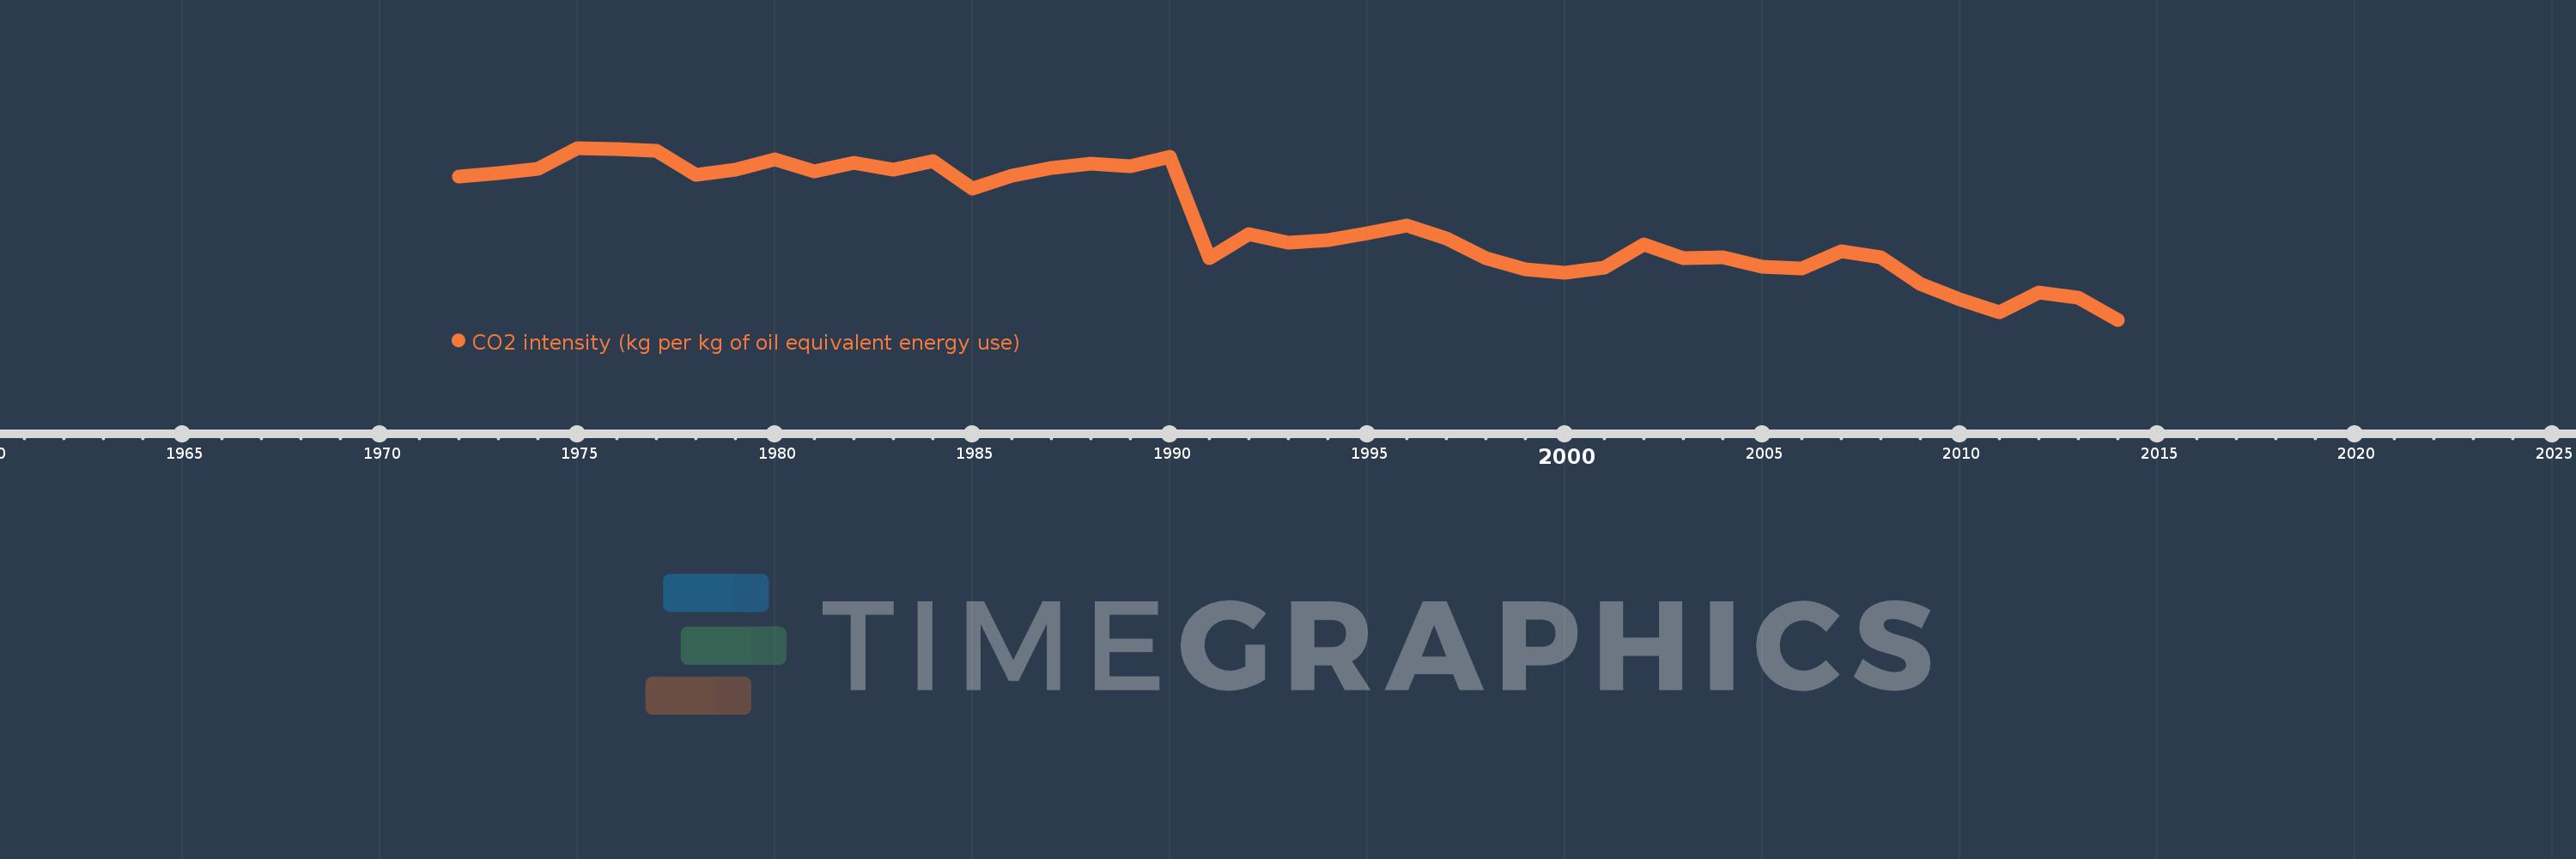
CO2 intensity (kg per kg of oil equivalent energy use)
2014,2013,2012,2011,2010,2009,2008,2007,2006,2005,2004,2003,2002,2001,2000,1999,1998,1997,1996,1995,1994,1993,1992,1991,1990,1989,1988,1987,1986,1985,1984,1983,1982,1981,1980,1979,1978,1977,1976,1975,1974,1973,1972
This statistics in other country:
AlbaniaAlgeriaAngolaAntigua and BarbudaArab WorldArgentinaArmeniaAustraliaAustriaAzerbaijanBahamas, TheBahrainBangladeshBarbadosBelarusBelgiumBelizeBeninBhutanBoliviaBosnia and HerzegovinaBotswanaBrazilBrunei DarussalamBulgariaCabo VerdeCambodiaCameroonCanadaCaribbean small statesCentral Europe and the BalticsChileChinaColombiaComorosCongo, Dem. Rep.Congo, Rep.Costa RicaCote d'IvoireCroatiaCubaCuracaoCyprusCzech RepublicDenmarkDjiboutiDominicaDominican RepublicEarly-demographic dividendEast Asia & PacificEast Asia & Pacific (excluding high income)East Asia & Pacific (IDA & IBRD countries)EcuadorEgypt, Arab Rep.El SalvadorEquatorial GuineaEritreaEstoniaEthiopiaEuro areaEurope & Central AsiaEurope & Central Asia (excluding high income)Europe & Central Asia (IDA & IBRD countries)European UnionFijiFinlandFragile and conflict affected situationsFranceGabonGambia, TheGeorgiaGermanyGhanaGibraltarGreeceGrenadaGuatemalaGuinea-BissauGuyanaHaitiHeavily indebted poor countries (HIPC)High incomeHondurasHong Kong SAR, ChinaHungaryIBRD onlyIcelandIDA & IBRD totalIDA blendIDA onlyIDA totalIndiaIndonesiaIran, Islamic Rep.IraqIrelandIsraelItalyJamaicaJapanJordanKazakhstanKenyaKiribatiKorea, Dem. People’s Rep.Korea, Rep.KuwaitKyrgyz RepublicLate-demographic dividendLatin America & Caribbean Latin America & Caribbean (excluding high income)Latin America & the Caribbean (IDA & IBRD countries)LatviaLeast developed countries: UN classificationLebanonLesothoLibyaLithuaniaLow & middle incomeLow incomeLower middle incomeLuxembourgMacedonia, FYRMalaysiaMaldivesMaltaMarshall IslandsMauritiusMexicoMiddle East & North AfricaMiddle East & North Africa (excluding high income)Middle East & North Africa (IDA & IBRD countries)Middle incomeMoldovaMongoliaMontenegroMoroccoMozambiqueMyanmarNamibiaNepalNetherlandsNew ZealandNicaraguaNigerNigeriaNorth AmericaNorwayOECD membersOmanOther small statesPacific island small statesPakistanPalauPanamaParaguayPeruPhilippinesPolandPortugalPost-demographic dividendPre-demographic dividendQatarRomaniaRussian FederationSamoaSao Tome and PrincipeSaudi ArabiaSenegalSerbiaSeychellesSingaporeSlovak RepublicSloveniaSmall statesSolomon IslandsSouth AfricaSouth AsiaSouth Asia (IDA & IBRD)South SudanSpainSri LankaSt. Kitts and NevisSt. LuciaSt. Vincent and the GrenadinesSub-Saharan Africa Sub-Saharan Africa (excluding high income)Sub-Saharan Africa (IDA & IBRD countries)SudanSurinameSwazilandSwedenSwitzerlandSyrian Arab RepublicTajikistanTanzaniaThailandTimor-LesteTogoTongaTrinidad and TobagoTunisiaTurkeyTurkmenistanUkraineUnited Arab EmiratesUnited KingdomUnited StatesUpper middle incomeUruguayUzbekistanVanuatuVenezuela, RBVietnamWorldYemen, Rep.ZambiaZimbabwe Timeline:
This timeline shows a graph from 1972 to 2014 of Romania. No data until 1971. Number of actual observations by date: 43.
Source name:
World Development Indicators
Source organization:
Carbon Dioxide Information Analysis Center, Environmental Sciences Division, Oak Ridge National Laboratory, Tennessee, United States.
Categories, topics:
Climate Change, Environment
Last updated:
apr 23, 2017
Indicators value changes by year
At the date of observation
Value
Absolute change
Change from previous value
jan 1, 1972
2.987
+2.987
0.0%
jan 1, 1973
3.007
+0.02
0.68%
jan 1, 1974
3.03
+0.023
0.77%
jan 1, 1975
3.14
+0.11
3.63%
jan 1, 1976
3.132
-0.008
-0.26%
jan 1, 1977
3.126
-0.007
-0.21%
jan 1, 1978
2.998
-0.128
-4.09%
jan 1, 1979
3.024
+0.026
0.87%
jan 1, 1980
3.079
+0.056
1.84%
jan 1, 1981
3.014
-0.065
-2.11%
jan 1, 1982
3.06
+0.046
1.52%
jan 1, 1983
3.023
-0.038
-1.23%
jan 1, 1984
3.072
+0.049
1.63%
jan 1, 1985
2.924
-0.148
-4.81%
jan 1, 1986
2.993
+0.069
2.34%
jan 1, 1987
3.031
+0.039
1.29%
jan 1, 1988
3.054
+0.022
0.73%
jan 1, 1989
3.042
-0.012
-0.38%
jan 1, 1990
3.095
+0.053
1.75%
jan 1, 1991
2.552
-0.543
-17.56%
jan 1, 1992
2.679
+0.127
4.99%
jan 1, 1993
2.634
-0.045
-1.68%
jan 1, 1994
2.646
+0.012
0.46%
jan 1, 1995
2.683
+0.036
1.38%
jan 1, 1996
2.728
+0.045
1.69%
jan 1, 1997
2.655
-0.073
-2.68%
jan 1, 1998
2.55
-0.105
-3.95%
jan 1, 1999
2.491
-0.059
-2.31%
jan 1, 2000
2.472
-0.019
-0.77%
jan 1, 2001
2.503
+0.031
1.27%
jan 1, 2002
2.624
+0.121
4.84%
jan 1, 2003
2.55
-0.075
-2.85%
jan 1, 2004
2.557
+0.007
0.28%
jan 1, 2005
2.505
-0.052
-2.03%
jan 1, 2006
2.499
-0.006
-0.22%
jan 1, 2007
2.588
+0.088
3.54%
jan 1, 2008
2.556
-0.032
-1.23%
jan 1, 2009
2.415
-0.141
-5.52%
jan 1, 2010
2.333
-0.082
-3.4%
jan 1, 2011
2.264
-0.069
-2.97%
jan 1, 2012
2.37
+0.107
4.73%
jan 1, 2013
2.339
-0.031
-1.32%
jan 1, 2014
2.223
-0.116
-4.96%
Ranking of countries by current statistics by years


Comments: