29
/
en
AIzaSyAYiBZKx7MnpbEhh9jyipgxe19OcubqV5w
April 1, 2024
112000
Costa Rica
CRI
true
2
1
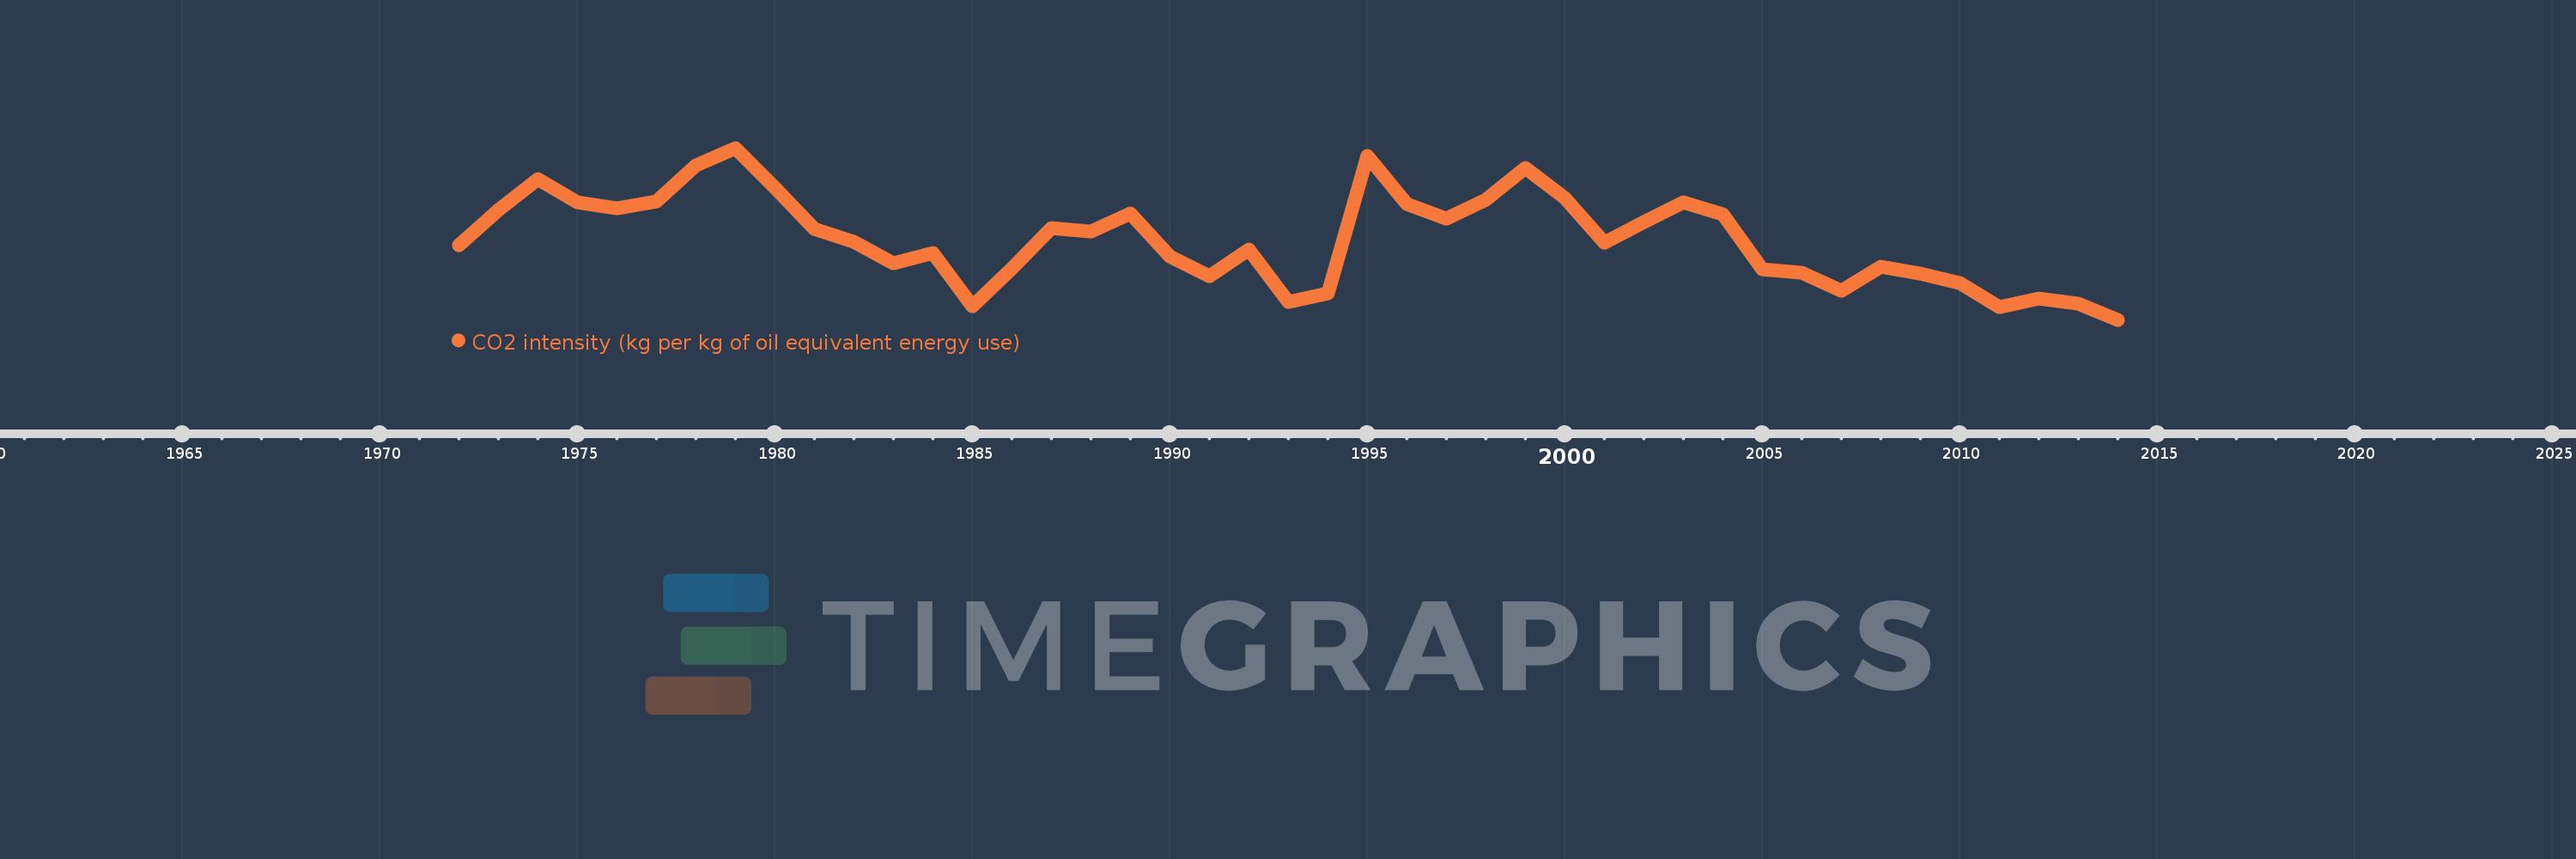
CO2 intensity (kg per kg of oil equivalent energy use)
2014,2013,2012,2011,2010,2009,2008,2007,2006,2005,2004,2003,2002,2001,2000,1999,1998,1997,1996,1995,1994,1993,1992,1991,1990,1989,1988,1987,1986,1985,1984,1983,1982,1981,1980,1979,1978,1977,1976,1975,1974,1973,1972
This statistics in other country:
AlbaniaAlgeriaAngolaAntigua and BarbudaArab WorldArgentinaArmeniaAustraliaAustriaAzerbaijanBahamas, TheBahrainBangladeshBarbadosBelarusBelgiumBelizeBeninBhutanBoliviaBosnia and HerzegovinaBotswanaBrazilBrunei DarussalamBulgariaCabo VerdeCambodiaCameroonCanadaCaribbean small statesCentral Europe and the BalticsChileChinaColombiaComorosCongo, Dem. Rep.Congo, Rep.Costa RicaCote d'IvoireCroatiaCubaCuracaoCyprusCzech RepublicDenmarkDjiboutiDominicaDominican RepublicEarly-demographic dividendEast Asia & PacificEast Asia & Pacific (excluding high income)East Asia & Pacific (IDA & IBRD countries)EcuadorEgypt, Arab Rep.El SalvadorEquatorial GuineaEritreaEstoniaEthiopiaEuro areaEurope & Central AsiaEurope & Central Asia (excluding high income)Europe & Central Asia (IDA & IBRD countries)European UnionFijiFinlandFragile and conflict affected situationsFranceGabonGambia, TheGeorgiaGermanyGhanaGibraltarGreeceGrenadaGuatemalaGuinea-BissauGuyanaHaitiHeavily indebted poor countries (HIPC)High incomeHondurasHong Kong SAR, ChinaHungaryIBRD onlyIcelandIDA & IBRD totalIDA blendIDA onlyIDA totalIndiaIndonesiaIran, Islamic Rep.IraqIrelandIsraelItalyJamaicaJapanJordanKazakhstanKenyaKiribatiKorea, Dem. People’s Rep.Korea, Rep.KuwaitKyrgyz RepublicLate-demographic dividendLatin America & Caribbean Latin America & Caribbean (excluding high income)Latin America & the Caribbean (IDA & IBRD countries)LatviaLeast developed countries: UN classificationLebanonLesothoLibyaLithuaniaLow & middle incomeLow incomeLower middle incomeLuxembourgMacedonia, FYRMalaysiaMaldivesMaltaMarshall IslandsMauritiusMexicoMiddle East & North AfricaMiddle East & North Africa (excluding high income)Middle East & North Africa (IDA & IBRD countries)Middle incomeMoldovaMongoliaMontenegroMoroccoMozambiqueMyanmarNamibiaNepalNetherlandsNew ZealandNicaraguaNigerNigeriaNorth AmericaNorwayOECD membersOmanOther small statesPacific island small statesPakistanPalauPanamaParaguayPeruPhilippinesPolandPortugalPost-demographic dividendPre-demographic dividendQatarRomaniaRussian FederationSamoaSao Tome and PrincipeSaudi ArabiaSenegalSerbiaSeychellesSingaporeSlovak RepublicSloveniaSmall statesSolomon IslandsSouth AfricaSouth AsiaSouth Asia (IDA & IBRD)South SudanSpainSri LankaSt. Kitts and NevisSt. LuciaSt. Vincent and the GrenadinesSub-Saharan Africa Sub-Saharan Africa (excluding high income)Sub-Saharan Africa (IDA & IBRD countries)SudanSurinameSwazilandSwedenSwitzerlandSyrian Arab RepublicTajikistanTanzaniaThailandTimor-LesteTogoTongaTrinidad and TobagoTunisiaTurkeyTurkmenistanUkraineUnited Arab EmiratesUnited KingdomUnited StatesUpper middle incomeUruguayUzbekistanVanuatuVenezuela, RBVietnamWorldYemen, Rep.ZambiaZimbabwe Timeline:
This timeline shows a graph from 1972 to 2014 of Costa Rica. No data until 1971. Number of actual observations by date: 43.
Source name:
World Development Indicators
Source organization:
Carbon Dioxide Information Analysis Center, Environmental Sciences Division, Oak Ridge National Laboratory, Tennessee, United States.
Categories, topics:
Climate Change, Environment
Last updated:
apr 23, 2017
Indicators value changes by year
At the date of observation
Value
Absolute change
Change from previous value
jan 1, 1972
1.895
+1.895
0.0%
jan 1, 1973
2.047
+0.152
8.04%
jan 1, 1974
2.183
+0.136
6.63%
jan 1, 1975
2.081
-0.103
-4.7%
jan 1, 1976
2.053
-0.027
-1.32%
jan 1, 1977
2.084
+0.03
1.48%
jan 1, 1978
2.242
+0.159
7.61%
jan 1, 1979
2.316
+0.073
3.28%
jan 1, 1980
2.143
-0.173
-7.47%
jan 1, 1981
1.964
-0.179
-8.37%
jan 1, 1982
1.911
-0.053
-2.7%
jan 1, 1983
1.816
-0.095
-4.97%
jan 1, 1984
1.862
+0.046
2.53%
jan 1, 1985
1.633
-0.229
-12.28%
jan 1, 1986
1.794
+0.161
9.87%
jan 1, 1987
1.969
+0.174
9.72%
jan 1, 1988
1.953
-0.015
-0.77%
jan 1, 1989
2.033
+0.08
4.08%
jan 1, 1990
1.847
-0.187
-9.18%
jan 1, 1991
1.762
-0.085
-4.6%
jan 1, 1992
1.875
+0.113
6.42%
jan 1, 1993
1.65
-0.225
-11.99%
jan 1, 1994
1.686
+0.036
2.17%
jan 1, 1995
2.281
+0.595
35.3%
jan 1, 1996
2.072
-0.208
-9.13%
jan 1, 1997
2.012
-0.06
-2.91%
jan 1, 1998
2.093
+0.081
4.02%
jan 1, 1999
2.23
+0.137
6.57%
jan 1, 2000
2.101
-0.13
-5.81%
jan 1, 2001
1.905
-0.196
-9.31%
jan 1, 2002
1.994
+0.089
4.68%
jan 1, 2003
2.081
+0.086
4.33%
jan 1, 2004
2.03
-0.051
-2.44%
jan 1, 2005
1.792
-0.238
-11.71%
jan 1, 2006
1.777
-0.016
-0.87%
jan 1, 2007
1.697
-0.079
-4.47%
jan 1, 2008
1.802
+0.104
6.14%
jan 1, 2009
1.773
-0.029
-1.6%
jan 1, 2010
1.733
-0.04
-2.26%
jan 1, 2011
1.629
-0.104
-5.98%
jan 1, 2012
1.663
+0.034
2.08%
jan 1, 2013
1.643
-0.02
-1.2%
jan 1, 2014
1.573
-0.07
-4.28%
Ranking of countries by current statistics by years


Comments: