29
/
en
AIzaSyAYiBZKx7MnpbEhh9jyipgxe19OcubqV5w
April 1, 2024
141314
Gibraltar
GIB
true
2
1
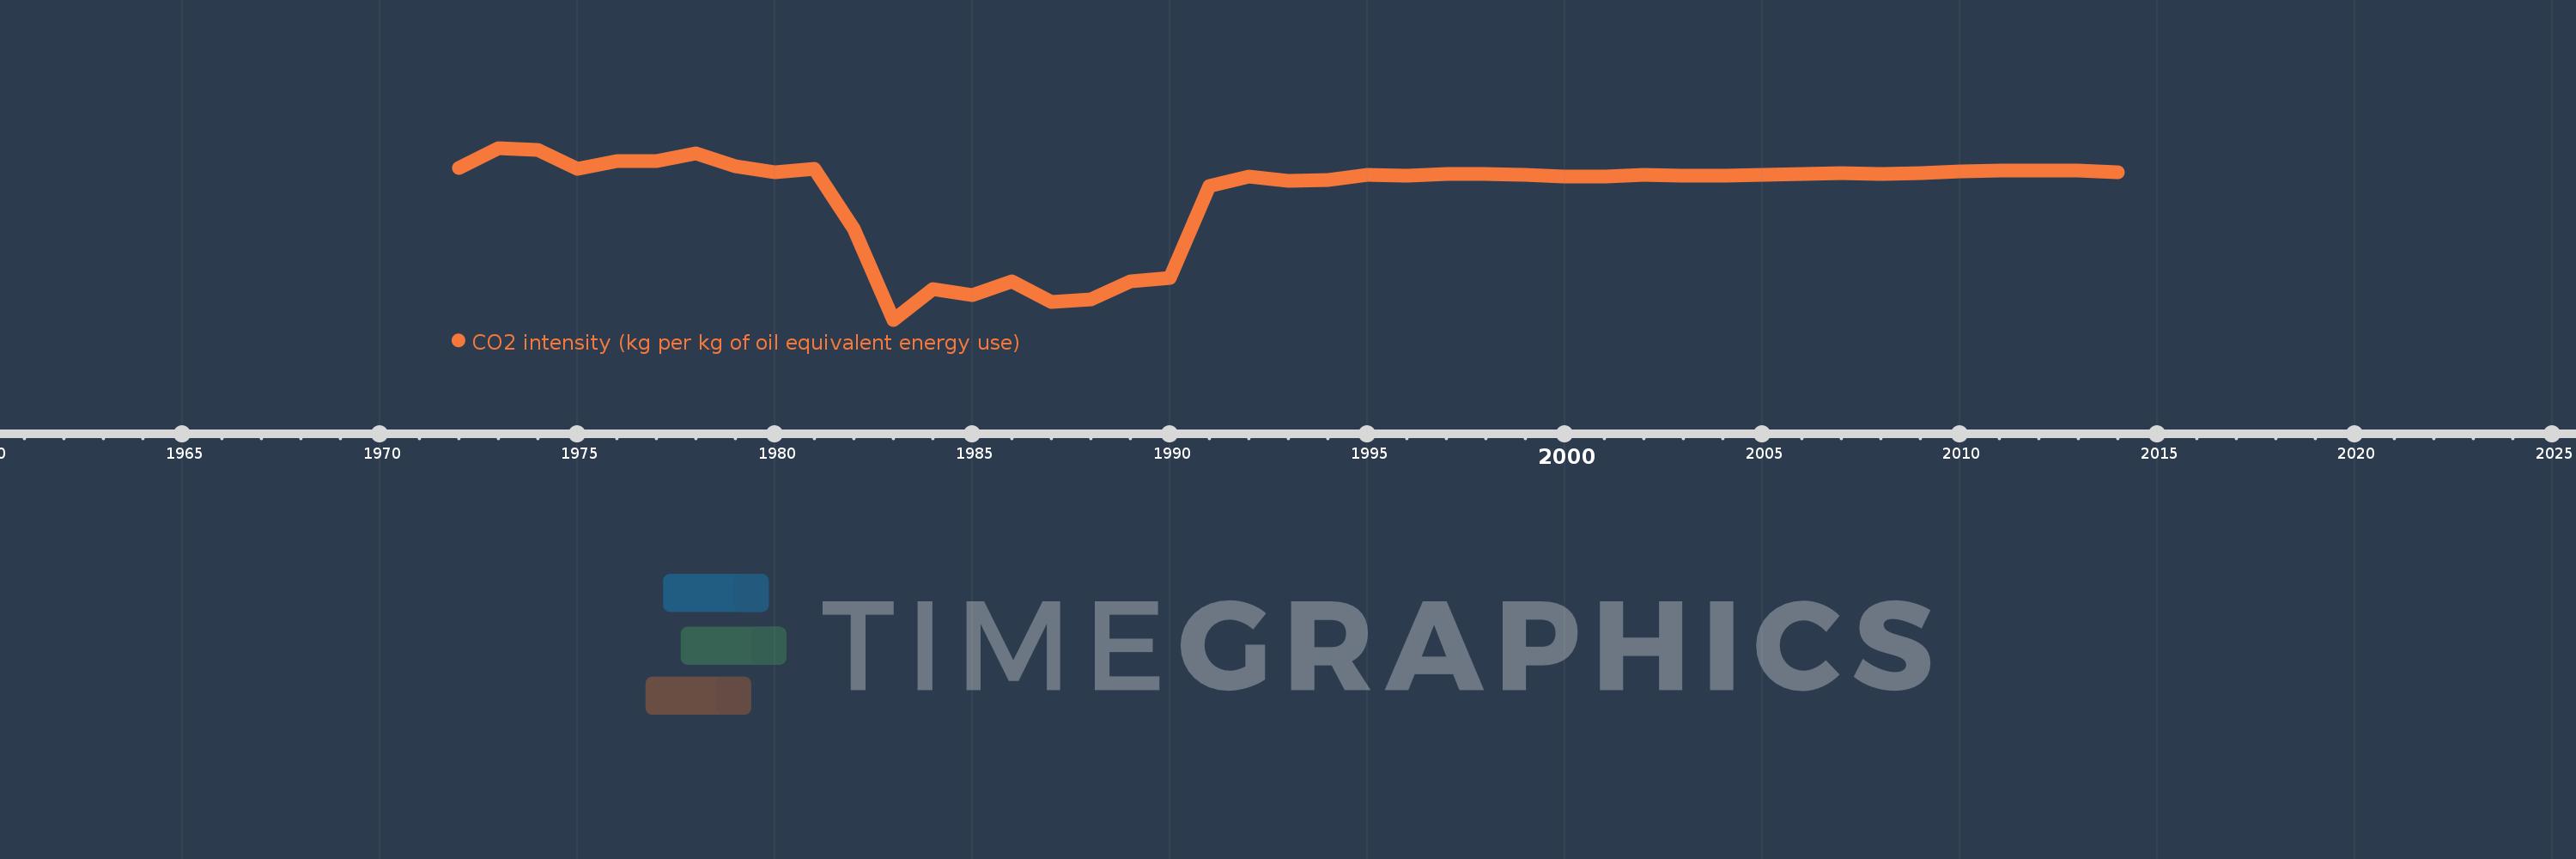
CO2 intensity (kg per kg of oil equivalent energy use)
2014,2013,2012,2011,2010,2009,2008,2007,2006,2005,2004,2003,2002,2001,2000,1999,1998,1997,1996,1995,1994,1993,1992,1991,1990,1989,1988,1987,1986,1985,1984,1983,1982,1981,1980,1979,1978,1977,1976,1975,1974,1973,1972
This statistics in other country:
AlbaniaAlgeriaAngolaAntigua and BarbudaArab WorldArgentinaArmeniaAustraliaAustriaAzerbaijanBahamas, TheBahrainBangladeshBarbadosBelarusBelgiumBelizeBeninBhutanBoliviaBosnia and HerzegovinaBotswanaBrazilBrunei DarussalamBulgariaCabo VerdeCambodiaCameroonCanadaCaribbean small statesCentral Europe and the BalticsChileChinaColombiaComorosCongo, Dem. Rep.Congo, Rep.Costa RicaCote d'IvoireCroatiaCubaCuracaoCyprusCzech RepublicDenmarkDjiboutiDominicaDominican RepublicEarly-demographic dividendEast Asia & PacificEast Asia & Pacific (excluding high income)East Asia & Pacific (IDA & IBRD countries)EcuadorEgypt, Arab Rep.El SalvadorEquatorial GuineaEritreaEstoniaEthiopiaEuro areaEurope & Central AsiaEurope & Central Asia (excluding high income)Europe & Central Asia (IDA & IBRD countries)European UnionFijiFinlandFragile and conflict affected situationsFranceGabonGambia, TheGeorgiaGermanyGhanaGibraltarGreeceGrenadaGuatemalaGuinea-BissauGuyanaHaitiHeavily indebted poor countries (HIPC)High incomeHondurasHong Kong SAR, ChinaHungaryIBRD onlyIcelandIDA & IBRD totalIDA blendIDA onlyIDA totalIndiaIndonesiaIran, Islamic Rep.IraqIrelandIsraelItalyJamaicaJapanJordanKazakhstanKenyaKiribatiKorea, Dem. People’s Rep.Korea, Rep.KuwaitKyrgyz RepublicLate-demographic dividendLatin America & Caribbean Latin America & Caribbean (excluding high income)Latin America & the Caribbean (IDA & IBRD countries)LatviaLeast developed countries: UN classificationLebanonLesothoLibyaLithuaniaLow & middle incomeLow incomeLower middle incomeLuxembourgMacedonia, FYRMalaysiaMaldivesMaltaMarshall IslandsMauritiusMexicoMiddle East & North AfricaMiddle East & North Africa (excluding high income)Middle East & North Africa (IDA & IBRD countries)Middle incomeMoldovaMongoliaMontenegroMoroccoMozambiqueMyanmarNamibiaNepalNetherlandsNew ZealandNicaraguaNigerNigeriaNorth AmericaNorwayOECD membersOmanOther small statesPacific island small statesPakistanPalauPanamaParaguayPeruPhilippinesPolandPortugalPost-demographic dividendPre-demographic dividendQatarRomaniaRussian FederationSamoaSao Tome and PrincipeSaudi ArabiaSenegalSerbiaSeychellesSingaporeSlovak RepublicSloveniaSmall statesSolomon IslandsSouth AfricaSouth AsiaSouth Asia (IDA & IBRD)South SudanSpainSri LankaSt. Kitts and NevisSt. LuciaSt. Vincent and the GrenadinesSub-Saharan Africa Sub-Saharan Africa (excluding high income)Sub-Saharan Africa (IDA & IBRD countries)SudanSurinameSwazilandSwedenSwitzerlandSyrian Arab RepublicTajikistanTanzaniaThailandTimor-LesteTogoTongaTrinidad and TobagoTunisiaTurkeyTurkmenistanUkraineUnited Arab EmiratesUnited KingdomUnited StatesUpper middle incomeUruguayUzbekistanVanuatuVenezuela, RBVietnamWorldYemen, Rep.ZambiaZimbabwe Timeline:
This timeline shows a graph from 1972 to 2014 of Gibraltar. No data until 1971. Number of actual observations by date: 43.
Source name:
World Development Indicators
Source organization:
Carbon Dioxide Information Analysis Center, Environmental Sciences Division, Oak Ridge National Laboratory, Tennessee, United States.
Categories, topics:
Climate Change, Environment
Last updated:
apr 23, 2017
Indicators value changes by year
At the date of observation
Value
Absolute change
Change from previous value
jan 1, 1972
2.732
+2.732
0.0%
jan 1, 1973
2.996
+0.263
9.64%
jan 1, 1974
2.971
-0.024
-0.81%
jan 1, 1975
2.716
-0.255
-8.59%
jan 1, 1976
2.816
+0.1
3.68%
jan 1, 1977
2.822
+0.006
0.21%
jan 1, 1978
2.925
+0.102
3.63%
jan 1, 1979
2.753
-0.172
-5.89%
jan 1, 1980
2.673
-0.08
-2.91%
jan 1, 1981
2.711
+0.038
1.42%
jan 1, 1982
1.916
-0.795
-29.32%
jan 1, 1983
0.694
-1.221
-63.75%
jan 1, 1984
1.1
+0.405
58.36%
jan 1, 1985
1.021
-0.079
-7.17%
jan 1, 1986
1.212
+0.191
18.73%
jan 1, 1987
0.927
-0.285
-23.5%
jan 1, 1988
0.962
+0.034
3.72%
jan 1, 1989
1.21
+0.248
25.79%
jan 1, 1990
1.257
+0.047
3.89%
jan 1, 1991
2.486
+1.229
97.79%
jan 1, 1992
2.617
+0.131
5.27%
jan 1, 1993
2.557
-0.059
-2.26%
jan 1, 1994
2.571
+0.013
0.52%
jan 1, 1995
2.641
+0.071
2.75%
jan 1, 1996
2.622
-0.019
-0.71%
jan 1, 1997
2.643
+0.02
0.77%
jan 1, 1998
2.646
+0.003
0.11%
jan 1, 1999
2.635
-0.011
-0.4%
jan 1, 2000
2.617
-0.018
-0.67%
jan 1, 2001
2.61
-0.007
-0.27%
jan 1, 2002
2.634
+0.023
0.9%
jan 1, 2003
2.622
-0.011
-0.44%
jan 1, 2004
2.619
-0.003
-0.1%
jan 1, 2005
2.636
+0.017
0.63%
jan 1, 2006
2.648
+0.012
0.44%
jan 1, 2007
2.663
+0.015
0.58%
jan 1, 2008
2.642
-0.021
-0.8%
jan 1, 2009
2.663
+0.021
0.81%
jan 1, 2010
2.687
+0.024
0.88%
jan 1, 2011
2.692
+0.005
0.2%
jan 1, 2012
2.692
+0.0
0.01%
jan 1, 2013
2.688
-0.004
-0.15%
jan 1, 2014
2.673
-0.015
-0.57%
Ranking of countries by current statistics by years


Comments: