29
/
en
AIzaSyAYiBZKx7MnpbEhh9jyipgxe19OcubqV5w
April 1, 2024
209140
New Zealand
NZL
true
2
1
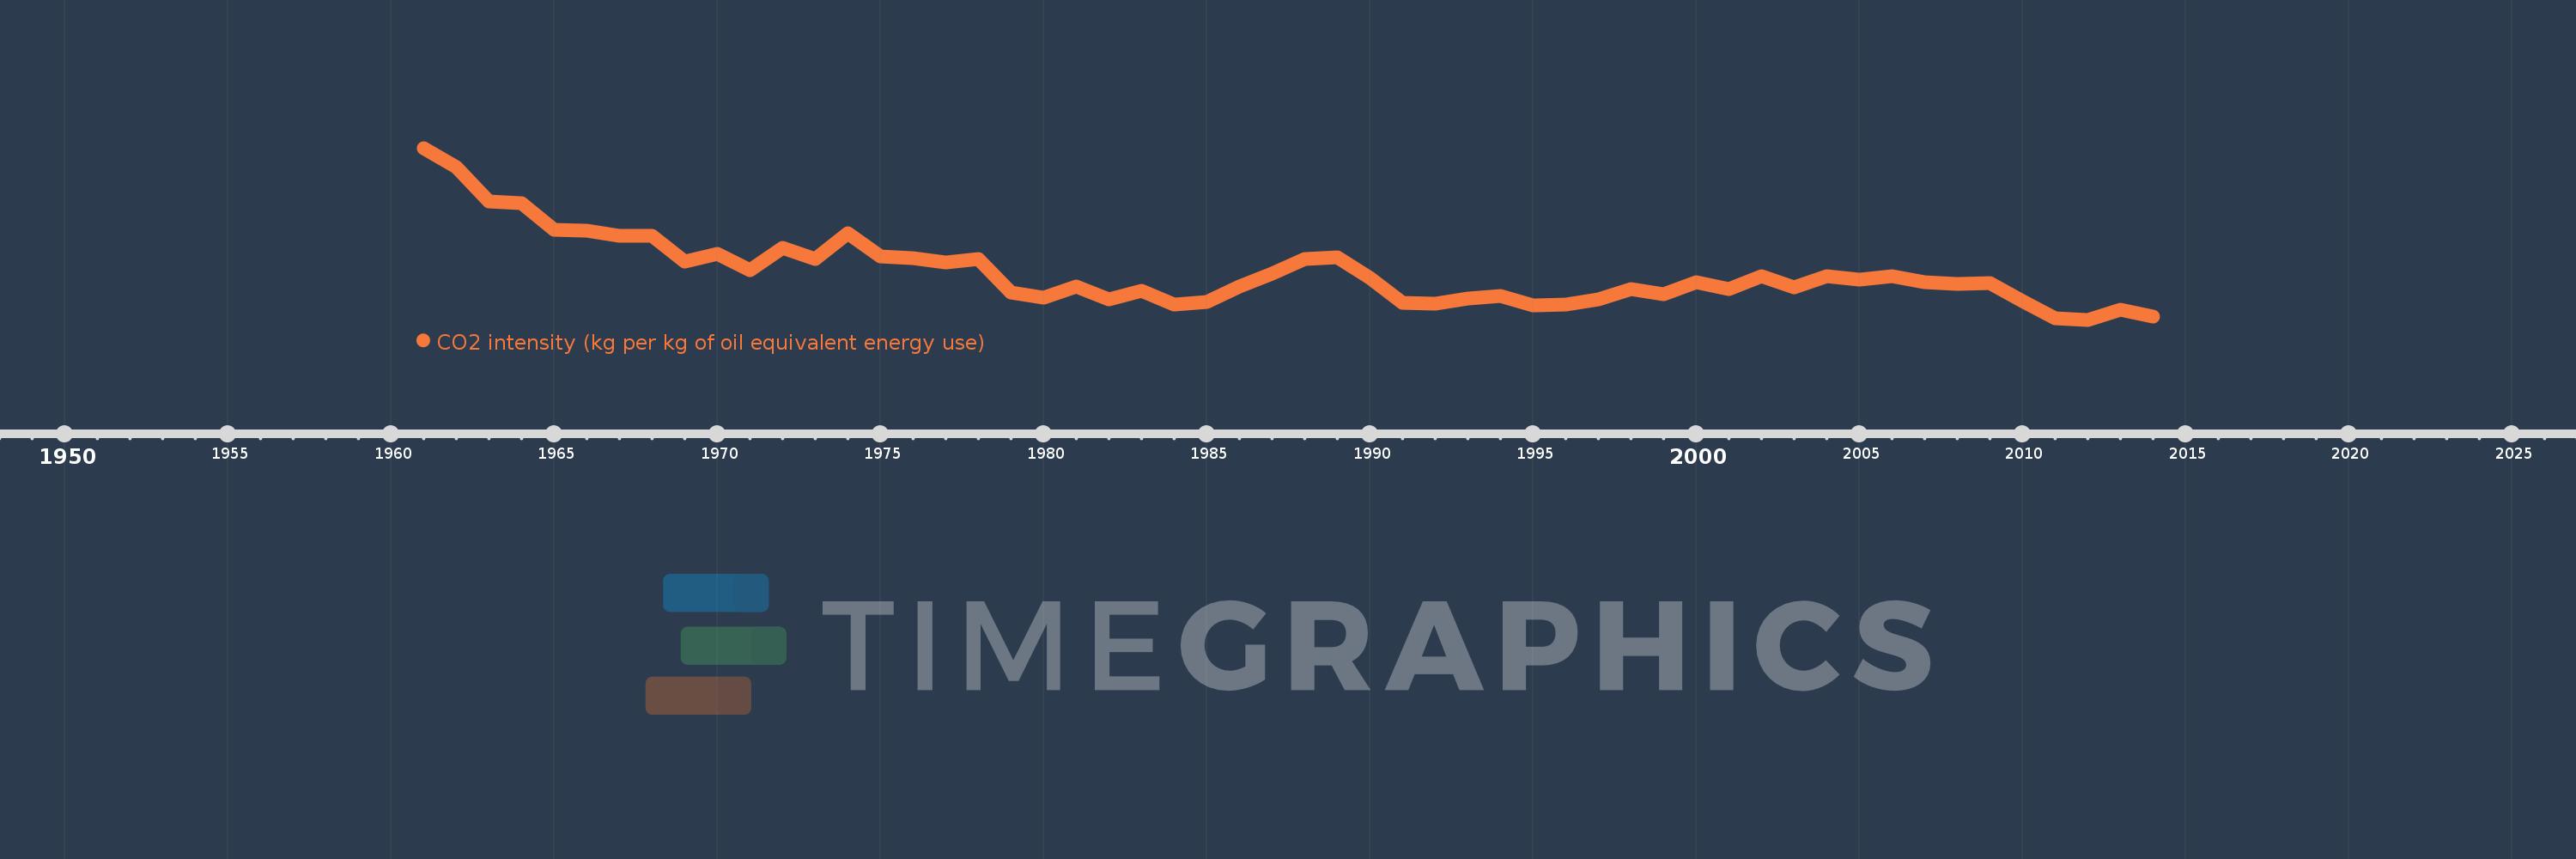
CO2 intensity (kg per kg of oil equivalent energy use)
2014,2013,2012,2011,2010,2009,2008,2007,2006,2005,2004,2003,2002,2001,2000,1999,1998,1997,1996,1995,1994,1993,1992,1991,1990,1989,1988,1987,1986,1985,1984,1983,1982,1981,1980,1979,1978,1977,1976,1975,1974,1973,1972,1971,1970,1969,1968,1967,1966,1965,1964,1963,1962,1961
This statistics in other country:
AlbaniaAlgeriaAngolaAntigua and BarbudaArab WorldArgentinaArmeniaAustraliaAustriaAzerbaijanBahamas, TheBahrainBangladeshBarbadosBelarusBelgiumBelizeBeninBhutanBoliviaBosnia and HerzegovinaBotswanaBrazilBrunei DarussalamBulgariaCabo VerdeCambodiaCameroonCanadaCaribbean small statesCentral Europe and the BalticsChileChinaColombiaComorosCongo, Dem. Rep.Congo, Rep.Costa RicaCote d'IvoireCroatiaCubaCuracaoCyprusCzech RepublicDenmarkDjiboutiDominicaDominican RepublicEarly-demographic dividendEast Asia & PacificEast Asia & Pacific (excluding high income)East Asia & Pacific (IDA & IBRD countries)EcuadorEgypt, Arab Rep.El SalvadorEquatorial GuineaEritreaEstoniaEthiopiaEuro areaEurope & Central AsiaEurope & Central Asia (excluding high income)Europe & Central Asia (IDA & IBRD countries)European UnionFijiFinlandFragile and conflict affected situationsFranceGabonGambia, TheGeorgiaGermanyGhanaGibraltarGreeceGrenadaGuatemalaGuinea-BissauGuyanaHaitiHeavily indebted poor countries (HIPC)High incomeHondurasHong Kong SAR, ChinaHungaryIBRD onlyIcelandIDA & IBRD totalIDA blendIDA onlyIDA totalIndiaIndonesiaIran, Islamic Rep.IraqIrelandIsraelItalyJamaicaJapanJordanKazakhstanKenyaKiribatiKorea, Dem. People’s Rep.Korea, Rep.KuwaitKyrgyz RepublicLate-demographic dividendLatin America & Caribbean Latin America & Caribbean (excluding high income)Latin America & the Caribbean (IDA & IBRD countries)LatviaLeast developed countries: UN classificationLebanonLesothoLibyaLithuaniaLow & middle incomeLow incomeLower middle incomeLuxembourgMacedonia, FYRMalaysiaMaldivesMaltaMarshall IslandsMauritiusMexicoMiddle East & North AfricaMiddle East & North Africa (excluding high income)Middle East & North Africa (IDA & IBRD countries)Middle incomeMoldovaMongoliaMontenegroMoroccoMozambiqueMyanmarNamibiaNepalNetherlandsNew ZealandNicaraguaNigerNigeriaNorth AmericaNorwayOECD membersOmanOther small statesPacific island small statesPakistanPalauPanamaParaguayPeruPhilippinesPolandPortugalPost-demographic dividendPre-demographic dividendQatarRomaniaRussian FederationSamoaSao Tome and PrincipeSaudi ArabiaSenegalSerbiaSeychellesSingaporeSlovak RepublicSloveniaSmall statesSolomon IslandsSouth AfricaSouth AsiaSouth Asia (IDA & IBRD)South SudanSpainSri LankaSt. Kitts and NevisSt. LuciaSt. Vincent and the GrenadinesSub-Saharan Africa Sub-Saharan Africa (excluding high income)Sub-Saharan Africa (IDA & IBRD countries)SudanSurinameSwazilandSwedenSwitzerlandSyrian Arab RepublicTajikistanTanzaniaThailandTimor-LesteTogoTongaTrinidad and TobagoTunisiaTurkeyTurkmenistanUkraineUnited Arab EmiratesUnited KingdomUnited StatesUpper middle incomeUruguayUzbekistanVanuatuVenezuela, RBVietnamWorldYemen, Rep.ZambiaZimbabwe Timeline:
This timeline shows a graph from 1961 to 2014 of New Zealand. No data until 1960. Number of actual observations by date: 54.
Source name:
World Development Indicators
Source organization:
Carbon Dioxide Information Analysis Center, Environmental Sciences Division, Oak Ridge National Laboratory, Tennessee, United States.
Categories, topics:
Climate Change, Environment
Last updated:
apr 23, 2017
Indicators value changes by year
At the date of observation
Value
Absolute change
Change from previous value
jan 1, 1961
2.887
+2.887
0.0%
jan 1, 1962
2.758
-0.129
-4.47%
jan 1, 1963
2.521
-0.237
-8.59%
jan 1, 1964
2.51
-0.011
-0.43%
jan 1, 1965
2.329
-0.181
-7.21%
jan 1, 1966
2.325
-0.004
-0.17%
jan 1, 1967
2.291
-0.035
-1.48%
jan 1, 1968
2.288
-0.003
-0.13%
jan 1, 1969
2.116
-0.172
-7.51%
jan 1, 1970
2.168
+0.052
2.45%
jan 1, 1971
2.055
-0.113
-5.22%
jan 1, 1972
2.206
+0.151
7.35%
jan 1, 1973
2.131
-0.075
-3.38%
jan 1, 1974
2.309
+0.178
8.35%
jan 1, 1975
2.152
-0.157
-6.8%
jan 1, 1976
2.137
-0.015
-0.72%
jan 1, 1977
2.112
-0.025
-1.16%
jan 1, 1978
2.13
+0.018
0.85%
jan 1, 1979
1.903
-0.227
-10.64%
jan 1, 1980
1.87
-0.033
-1.76%
jan 1, 1981
1.943
+0.073
3.93%
jan 1, 1982
1.856
-0.087
-4.5%
jan 1, 1983
1.918
+0.062
3.36%
jan 1, 1984
1.825
-0.093
-4.85%
jan 1, 1985
1.839
+0.014
0.78%
jan 1, 1986
1.947
+0.108
5.88%
jan 1, 1987
2.036
+0.088
4.54%
jan 1, 1988
2.132
+0.097
4.75%
jan 1, 1989
2.143
+0.01
0.49%
jan 1, 1990
2.002
-0.141
-6.58%
jan 1, 1991
1.835
-0.167
-8.35%
jan 1, 1992
1.831
-0.004
-0.2%
jan 1, 1993
1.865
+0.034
1.85%
jan 1, 1994
1.883
+0.018
0.97%
jan 1, 1995
1.818
-0.065
-3.47%
jan 1, 1996
1.822
+0.005
0.25%
jan 1, 1997
1.858
+0.036
1.96%
jan 1, 1998
1.926
+0.069
3.7%
jan 1, 1999
1.891
-0.036
-1.85%
jan 1, 2000
1.976
+0.085
4.48%
jan 1, 2001
1.93
-0.046
-2.32%
jan 1, 2002
2.014
+0.084
4.37%
jan 1, 2003
1.939
-0.075
-3.75%
jan 1, 2004
2.016
+0.077
4.0%
jan 1, 2005
1.994
-0.022
-1.1%
jan 1, 2006
2.017
+0.023
1.14%
jan 1, 2007
1.975
-0.042
-2.07%
jan 1, 2008
1.964
-0.011
-0.54%
jan 1, 2009
1.967
+0.002
0.12%
jan 1, 2010
1.848
-0.119
-6.03%
jan 1, 2011
1.729
-0.119
-6.45%
jan 1, 2012
1.72
-0.008
-0.49%
jan 1, 2013
1.789
+0.069
4.0%
jan 1, 2014
1.741
-0.048
-2.7%
Ranking of countries by current statistics by years


Comments: