29
/
en
AIzaSyAYiBZKx7MnpbEhh9jyipgxe19OcubqV5w
April 1, 2024
227237
Qatar
QAT
true
2
1
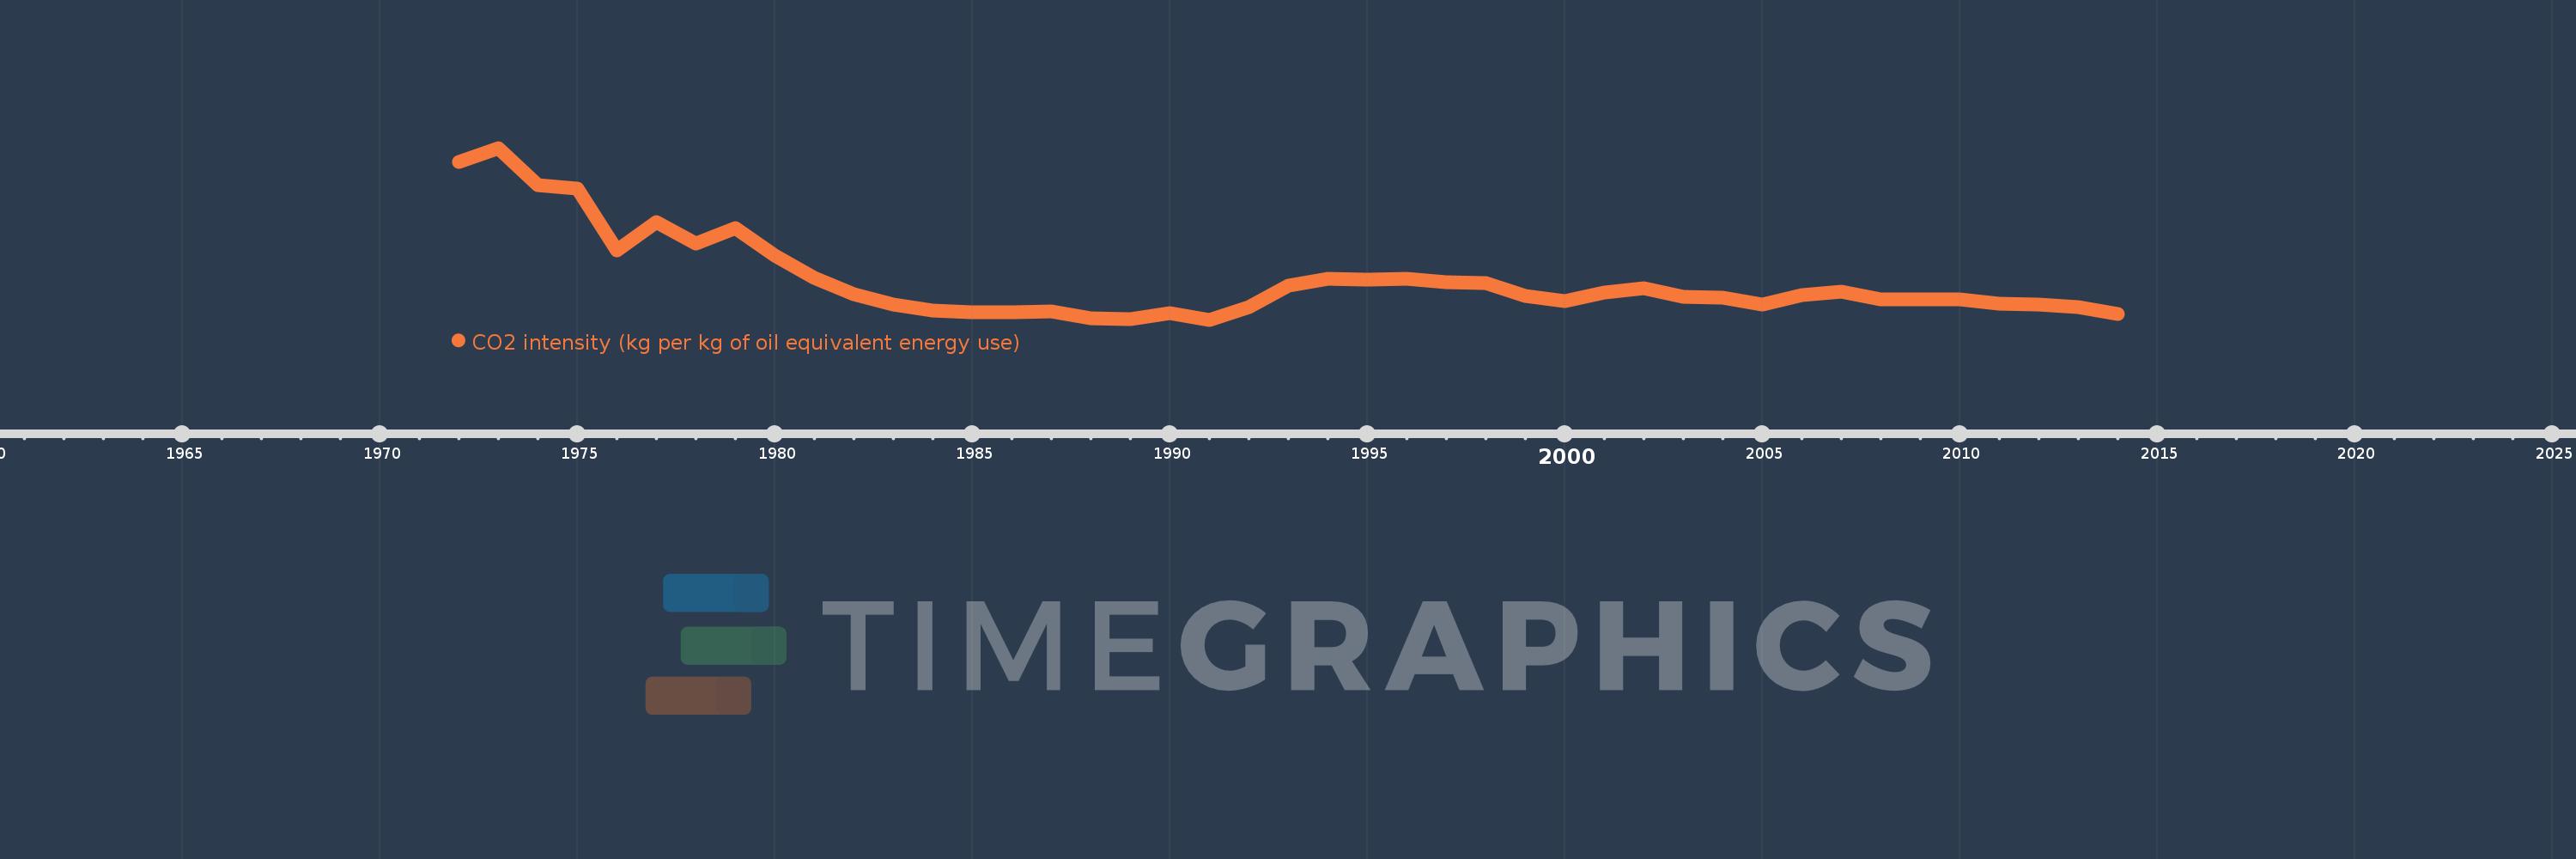
CO2 intensity (kg per kg of oil equivalent energy use)
2014,2013,2012,2011,2010,2009,2008,2007,2006,2005,2004,2003,2002,2001,2000,1999,1998,1997,1996,1995,1994,1993,1992,1991,1990,1989,1988,1987,1986,1985,1984,1983,1982,1981,1980,1979,1978,1977,1976,1975,1974,1973,1972
This statistics in other country:
AlbaniaAlgeriaAngolaAntigua and BarbudaArab WorldArgentinaArmeniaAustraliaAustriaAzerbaijanBahamas, TheBahrainBangladeshBarbadosBelarusBelgiumBelizeBeninBhutanBoliviaBosnia and HerzegovinaBotswanaBrazilBrunei DarussalamBulgariaCabo VerdeCambodiaCameroonCanadaCaribbean small statesCentral Europe and the BalticsChileChinaColombiaComorosCongo, Dem. Rep.Congo, Rep.Costa RicaCote d'IvoireCroatiaCubaCuracaoCyprusCzech RepublicDenmarkDjiboutiDominicaDominican RepublicEarly-demographic dividendEast Asia & PacificEast Asia & Pacific (excluding high income)East Asia & Pacific (IDA & IBRD countries)EcuadorEgypt, Arab Rep.El SalvadorEquatorial GuineaEritreaEstoniaEthiopiaEuro areaEurope & Central AsiaEurope & Central Asia (excluding high income)Europe & Central Asia (IDA & IBRD countries)European UnionFijiFinlandFragile and conflict affected situationsFranceGabonGambia, TheGeorgiaGermanyGhanaGibraltarGreeceGrenadaGuatemalaGuinea-BissauGuyanaHaitiHeavily indebted poor countries (HIPC)High incomeHondurasHong Kong SAR, ChinaHungaryIBRD onlyIcelandIDA & IBRD totalIDA blendIDA onlyIDA totalIndiaIndonesiaIran, Islamic Rep.IraqIrelandIsraelItalyJamaicaJapanJordanKazakhstanKenyaKiribatiKorea, Dem. People’s Rep.Korea, Rep.KuwaitKyrgyz RepublicLate-demographic dividendLatin America & Caribbean Latin America & Caribbean (excluding high income)Latin America & the Caribbean (IDA & IBRD countries)LatviaLeast developed countries: UN classificationLebanonLesothoLibyaLithuaniaLow & middle incomeLow incomeLower middle incomeLuxembourgMacedonia, FYRMalaysiaMaldivesMaltaMarshall IslandsMauritiusMexicoMiddle East & North AfricaMiddle East & North Africa (excluding high income)Middle East & North Africa (IDA & IBRD countries)Middle incomeMoldovaMongoliaMontenegroMoroccoMozambiqueMyanmarNamibiaNepalNetherlandsNew ZealandNicaraguaNigerNigeriaNorth AmericaNorwayOECD membersOmanOther small statesPacific island small statesPakistanPalauPanamaParaguayPeruPhilippinesPolandPortugalPost-demographic dividendPre-demographic dividendQatarRomaniaRussian FederationSamoaSao Tome and PrincipeSaudi ArabiaSenegalSerbiaSeychellesSingaporeSlovak RepublicSloveniaSmall statesSolomon IslandsSouth AfricaSouth AsiaSouth Asia (IDA & IBRD)South SudanSpainSri LankaSt. Kitts and NevisSt. LuciaSt. Vincent and the GrenadinesSub-Saharan Africa Sub-Saharan Africa (excluding high income)Sub-Saharan Africa (IDA & IBRD countries)SudanSurinameSwazilandSwedenSwitzerlandSyrian Arab RepublicTajikistanTanzaniaThailandTimor-LesteTogoTongaTrinidad and TobagoTunisiaTurkeyTurkmenistanUkraineUnited Arab EmiratesUnited KingdomUnited StatesUpper middle incomeUruguayUzbekistanVanuatuVenezuela, RBVietnamWorldYemen, Rep.ZambiaZimbabwe Timeline:
This timeline shows a graph from 1972 to 2014 of Qatar. No data until 1971. Number of actual observations by date: 43.
Source name:
World Development Indicators
Source organization:
Carbon Dioxide Information Analysis Center, Environmental Sciences Division, Oak Ridge National Laboratory, Tennessee, United States.
Categories, topics:
Climate Change, Environment
Last updated:
apr 23, 2017
Indicators value changes by year
Maximum:
10.591
jan 1, 1973
At the date of observation
Value
Absolute change
Change from previous value
jan 1, 1972
9.885
+9.885
0.0%
jan 1, 1973
10.591
+0.706
7.14%
jan 1, 1974
8.703
-1.888
-17.82%
jan 1, 1975
8.52
-0.183
-2.11%
jan 1, 1976
5.369
-3.151
-36.99%
jan 1, 1977
6.796
+1.427
26.58%
jan 1, 1978
5.719
-1.077
-15.84%
jan 1, 1979
6.494
+0.775
13.56%
jan 1, 1980
5.099
-1.396
-21.49%
jan 1, 1981
3.955
-1.144
-22.43%
jan 1, 1982
3.102
-0.854
-21.58%
jan 1, 1983
2.569
-0.533
-17.18%
jan 1, 1984
2.269
-0.3
-11.67%
jan 1, 1985
2.192
-0.077
-3.38%
jan 1, 1986
2.197
+0.005
0.21%
jan 1, 1987
2.217
+0.02
0.9%
jan 1, 1988
1.859
-0.358
-16.14%
jan 1, 1989
1.844
-0.015
-0.8%
jan 1, 1990
2.162
+0.318
17.22%
jan 1, 1991
1.804
-0.357
-16.54%
jan 1, 1992
2.447
+0.643
35.66%
jan 1, 1993
3.549
+1.102
45.02%
jan 1, 1994
3.921
+0.372
10.47%
jan 1, 1995
3.843
-0.078
-1.99%
jan 1, 1996
3.901
+0.058
1.51%
jan 1, 1997
3.735
-0.166
-4.25%
jan 1, 1998
3.685
-0.05
-1.34%
jan 1, 1999
3.032
-0.653
-17.72%
jan 1, 2000
2.775
-0.257
-8.48%
jan 1, 2001
3.18
+0.405
14.6%
jan 1, 2002
3.43
+0.25
7.86%
jan 1, 2003
2.997
-0.434
-12.65%
jan 1, 2004
2.938
-0.058
-1.95%
jan 1, 2005
2.577
-0.361
-12.29%
jan 1, 2006
3.058
+0.481
18.65%
jan 1, 2007
3.24
+0.182
5.96%
jan 1, 2008
2.859
-0.381
-11.77%
jan 1, 2009
2.851
-0.008
-0.27%
jan 1, 2010
2.856
+0.006
0.2%
jan 1, 2011
2.627
-0.229
-8.03%
jan 1, 2012
2.57
-0.057
-2.16%
jan 1, 2013
2.471
-0.099
-3.86%
jan 1, 2014
2.116
-0.355
-14.35%
Ranking of countries by current statistics by years


Comments: