29
/
en
AIzaSyAYiBZKx7MnpbEhh9jyipgxe19OcubqV5w
April 1, 2024
30524
Europe & Central Asia
ECS
false
2
1
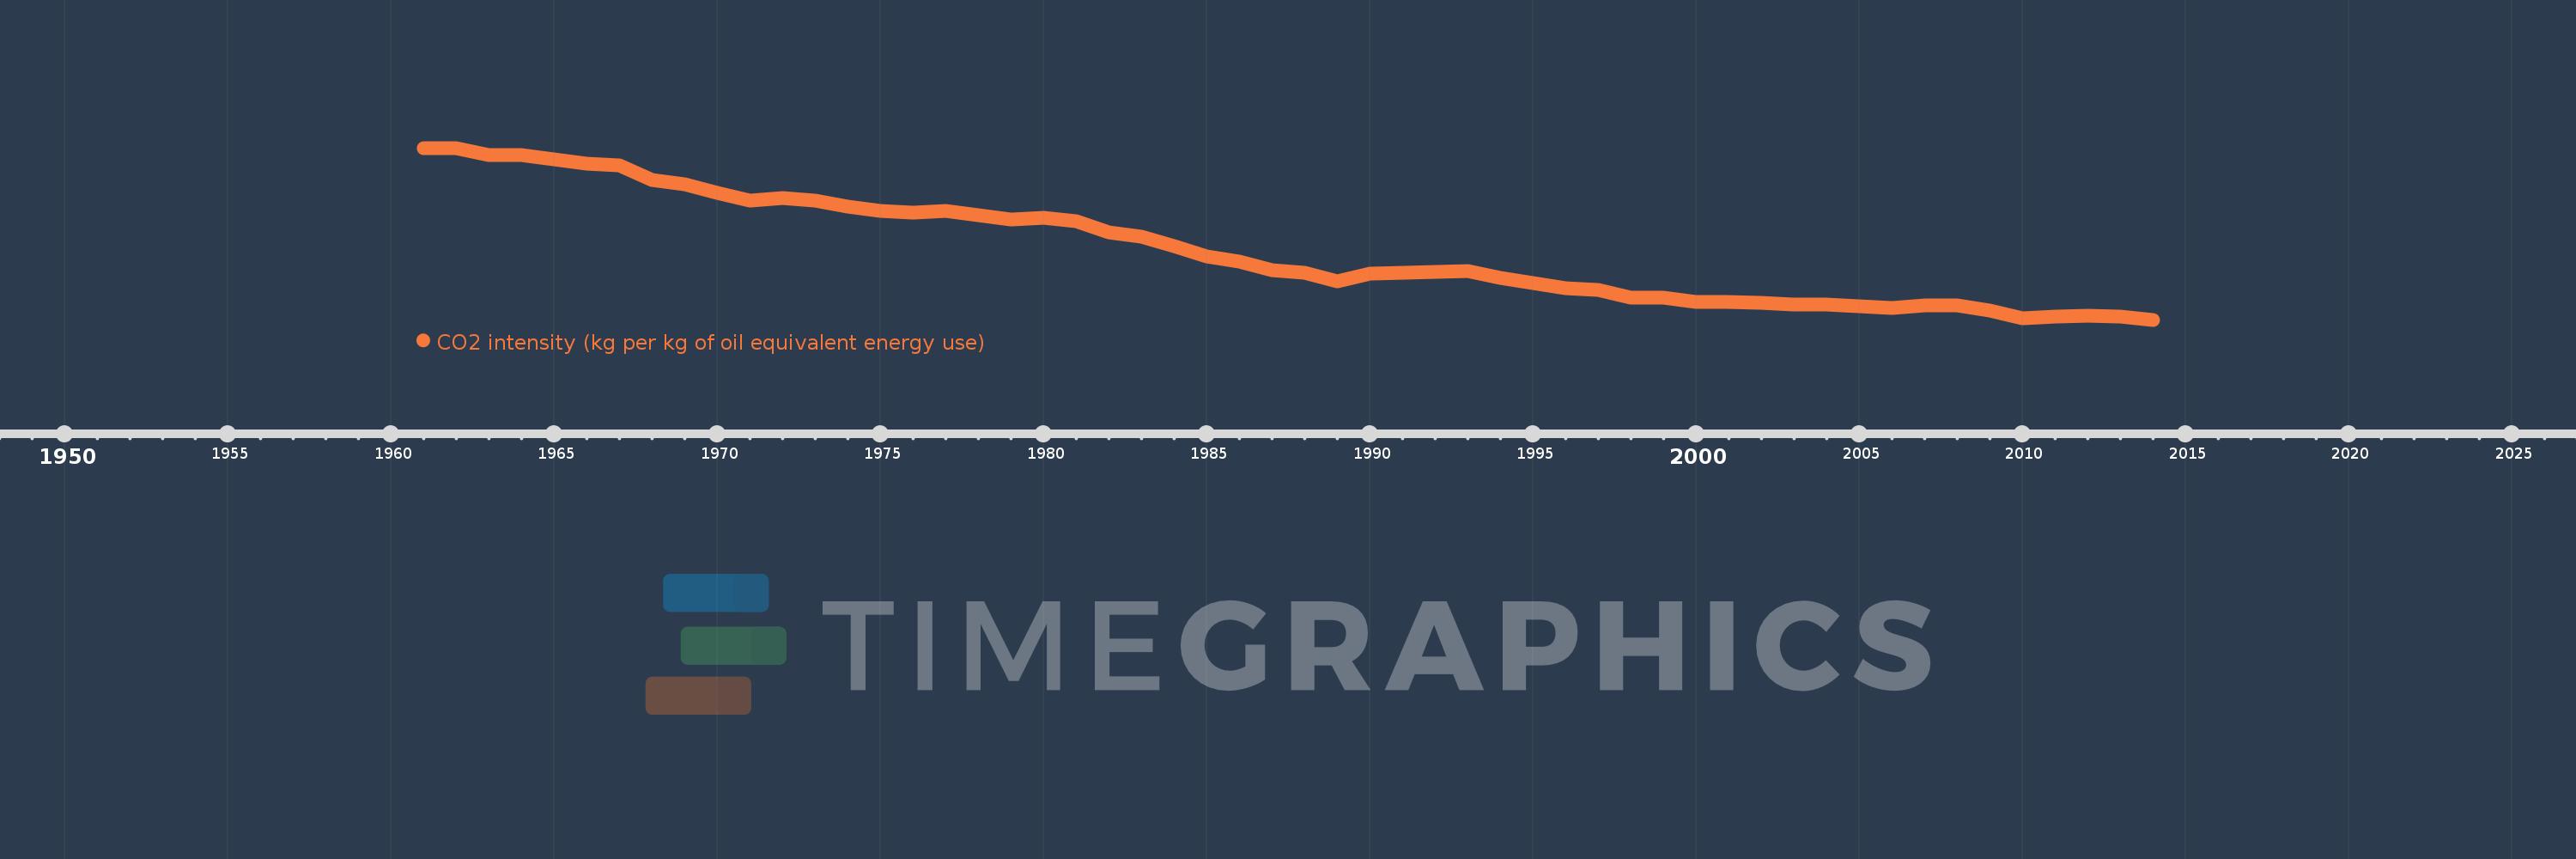
CO2 intensity (kg per kg of oil equivalent energy use)
2014,2013,2012,2011,2010,2009,2008,2007,2006,2005,2004,2003,2002,2001,2000,1999,1998,1997,1996,1995,1994,1993,1990,1989,1988,1987,1986,1985,1984,1983,1982,1981,1980,1979,1978,1977,1976,1975,1974,1973,1972,1971,1970,1969,1968,1967,1966,1965,1964,1963,1962,1961
This statistics in other country:
AlbaniaAlgeriaAngolaAntigua and BarbudaArab WorldArgentinaArmeniaAustraliaAustriaAzerbaijanBahamas, TheBahrainBangladeshBarbadosBelarusBelgiumBelizeBeninBhutanBoliviaBosnia and HerzegovinaBotswanaBrazilBrunei DarussalamBulgariaCabo VerdeCambodiaCameroonCanadaCaribbean small statesCentral Europe and the BalticsChileChinaColombiaComorosCongo, Dem. Rep.Congo, Rep.Costa RicaCote d'IvoireCroatiaCubaCuracaoCyprusCzech RepublicDenmarkDjiboutiDominicaDominican RepublicEarly-demographic dividendEast Asia & PacificEast Asia & Pacific (excluding high income)East Asia & Pacific (IDA & IBRD countries)EcuadorEgypt, Arab Rep.El SalvadorEquatorial GuineaEritreaEstoniaEthiopiaEuro areaEurope & Central AsiaEurope & Central Asia (excluding high income)Europe & Central Asia (IDA & IBRD countries)European UnionFijiFinlandFragile and conflict affected situationsFranceGabonGambia, TheGeorgiaGermanyGhanaGibraltarGreeceGrenadaGuatemalaGuinea-BissauGuyanaHaitiHeavily indebted poor countries (HIPC)High incomeHondurasHong Kong SAR, ChinaHungaryIBRD onlyIcelandIDA & IBRD totalIDA blendIDA onlyIDA totalIndiaIndonesiaIran, Islamic Rep.IraqIrelandIsraelItalyJamaicaJapanJordanKazakhstanKenyaKiribatiKorea, Dem. People’s Rep.Korea, Rep.KuwaitKyrgyz RepublicLate-demographic dividendLatin America & Caribbean Latin America & Caribbean (excluding high income)Latin America & the Caribbean (IDA & IBRD countries)LatviaLeast developed countries: UN classificationLebanonLesothoLibyaLithuaniaLow & middle incomeLow incomeLower middle incomeLuxembourgMacedonia, FYRMalaysiaMaldivesMaltaMarshall IslandsMauritiusMexicoMiddle East & North AfricaMiddle East & North Africa (excluding high income)Middle East & North Africa (IDA & IBRD countries)Middle incomeMoldovaMongoliaMontenegroMoroccoMozambiqueMyanmarNamibiaNepalNetherlandsNew ZealandNicaraguaNigerNigeriaNorth AmericaNorwayOECD membersOmanOther small statesPacific island small statesPakistanPalauPanamaParaguayPeruPhilippinesPolandPortugalPost-demographic dividendPre-demographic dividendQatarRomaniaRussian FederationSamoaSao Tome and PrincipeSaudi ArabiaSenegalSerbiaSeychellesSingaporeSlovak RepublicSloveniaSmall statesSolomon IslandsSouth AfricaSouth AsiaSouth Asia (IDA & IBRD)South SudanSpainSri LankaSt. Kitts and NevisSt. LuciaSt. Vincent and the GrenadinesSub-Saharan Africa Sub-Saharan Africa (excluding high income)Sub-Saharan Africa (IDA & IBRD countries)SudanSurinameSwazilandSwedenSwitzerlandSyrian Arab RepublicTajikistanTanzaniaThailandTimor-LesteTogoTongaTrinidad and TobagoTunisiaTurkeyTurkmenistanUkraineUnited Arab EmiratesUnited KingdomUnited StatesUpper middle incomeUruguayUzbekistanVanuatuVenezuela, RBVietnamWorldYemen, Rep.ZambiaZimbabwe Timeline:
This timeline shows a graph from 1961 to 2014 of Europe & Central Asia. No data until 1960. Number of actual observations by date: 52.
Source name:
World Development Indicators
Source organization:
Carbon Dioxide Information Analysis Center, Environmental Sciences Division, Oak Ridge National Laboratory, Tennessee, United States.
Categories, topics:
Climate Change, Environment
Last updated:
apr 23, 2017
Indicators value changes by year
At the date of observation
Value
Absolute change
Change from previous value
jan 1, 1961
3.321
+3.321
0.0%
jan 1, 1962
3.32
-0.001
-0.04%
jan 1, 1963
3.277
-0.042
-1.27%
jan 1, 1964
3.279
+0.001
0.03%
jan 1, 1965
3.252
-0.026
-0.8%
jan 1, 1966
3.225
-0.027
-0.84%
jan 1, 1967
3.212
-0.013
-0.39%
jan 1, 1968
3.122
-0.09
-2.81%
jan 1, 1969
3.098
-0.024
-0.75%
jan 1, 1970
3.047
-0.052
-1.67%
jan 1, 1971
2.996
-0.05
-1.66%
jan 1, 1972
3.013
+0.016
0.55%
jan 1, 1973
2.995
-0.018
-0.6%
jan 1, 1974
2.959
-0.035
-1.19%
jan 1, 1975
2.933
-0.026
-0.89%
jan 1, 1976
2.924
-0.009
-0.3%
jan 1, 1977
2.932
+0.008
0.28%
jan 1, 1978
2.905
-0.027
-0.93%
jan 1, 1979
2.879
-0.026
-0.88%
jan 1, 1980
2.889
+0.01
0.33%
jan 1, 1981
2.868
-0.02
-0.71%
jan 1, 1982
2.802
-0.067
-2.33%
jan 1, 1983
2.776
-0.026
-0.92%
jan 1, 1984
2.715
-0.06
-2.18%
jan 1, 1985
2.655
-0.06
-2.22%
jan 1, 1986
2.623
-0.032
-1.21%
jan 1, 1987
2.57
-0.053
-2.02%
jan 1, 1988
2.552
-0.018
-0.7%
jan 1, 1989
2.499
-0.053
-2.06%
jan 1, 1990
2.547
+0.047
1.9%
jan 1, 1993
2.565
+0.018
0.72%
jan 1, 1994
2.521
-0.045
-1.74%
jan 1, 1995
2.491
-0.029
-1.15%
jan 1, 1996
2.46
-0.032
-1.27%
jan 1, 1997
2.447
-0.013
-0.51%
jan 1, 1998
2.401
-0.047
-1.91%
jan 1, 1999
2.399
-0.001
-0.06%
jan 1, 2000
2.376
-0.024
-0.98%
jan 1, 2001
2.372
-0.003
-0.14%
jan 1, 2002
2.366
-0.006
-0.27%
jan 1, 2003
2.357
-0.009
-0.38%
jan 1, 2004
2.359
+0.002
0.09%
jan 1, 2005
2.346
-0.013
-0.55%
jan 1, 2006
2.337
-0.009
-0.37%
jan 1, 2007
2.352
+0.014
0.62%
jan 1, 2008
2.354
+0.002
0.09%
jan 1, 2009
2.321
-0.032
-1.38%
jan 1, 2010
2.272
-0.049
-2.11%
jan 1, 2011
2.283
+0.011
0.47%
jan 1, 2012
2.289
+0.006
0.27%
jan 1, 2013
2.284
-0.006
-0.25%
jan 1, 2014
2.264
-0.02
-0.88%
Ranking of countries by current statistics by years


Comments: