29
/
en
AIzaSyAYiBZKx7MnpbEhh9jyipgxe19OcubqV5w
April 1, 2024
276461
United States
USA
true
2
1
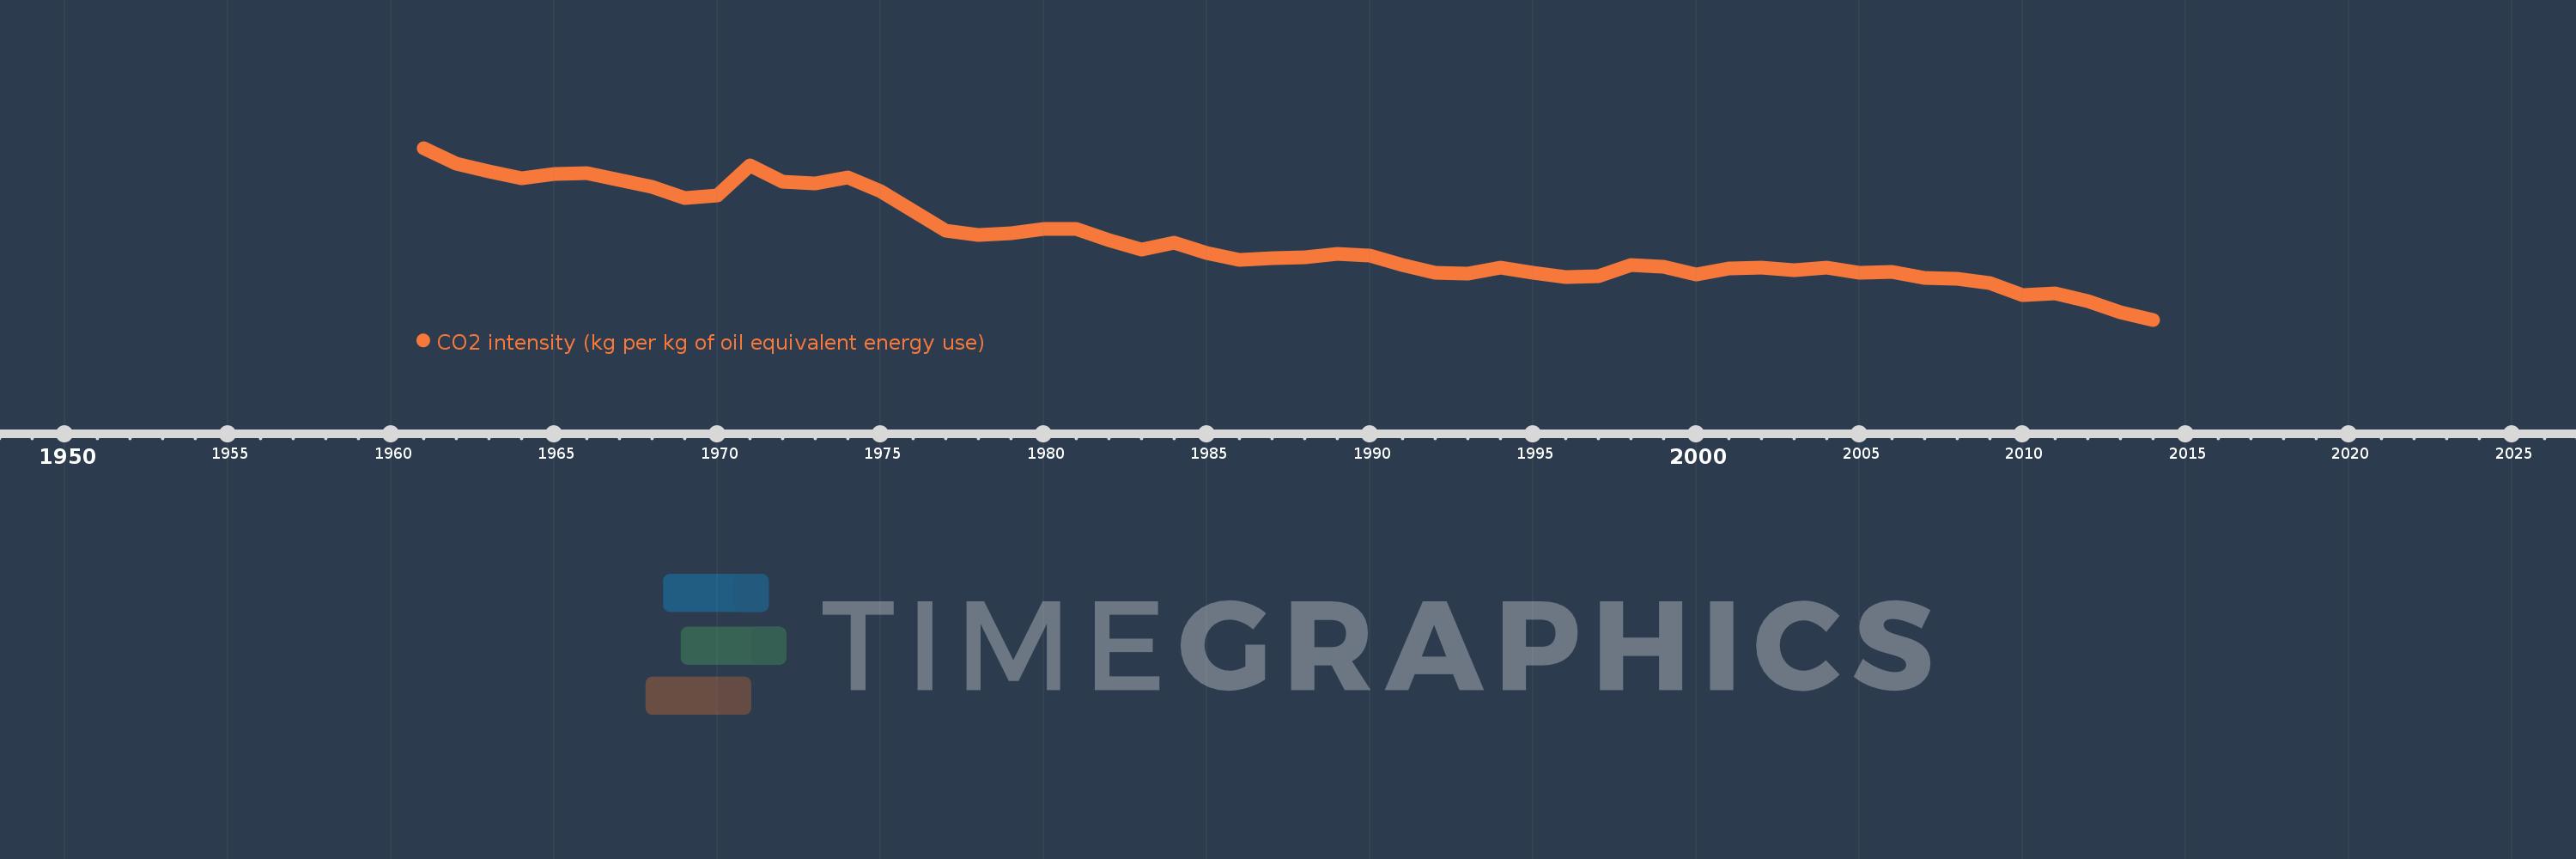
CO2 intensity (kg per kg of oil equivalent energy use)
2014,2013,2012,2011,2010,2009,2008,2007,2006,2005,2004,2003,2002,2001,2000,1999,1998,1997,1996,1995,1994,1993,1992,1991,1990,1989,1988,1987,1986,1985,1984,1983,1982,1981,1980,1979,1978,1977,1976,1975,1974,1973,1972,1971,1970,1969,1968,1967,1966,1965,1964,1963,1962,1961
This statistics in other country:
AlbaniaAlgeriaAngolaAntigua and BarbudaArab WorldArgentinaArmeniaAustraliaAustriaAzerbaijanBahamas, TheBahrainBangladeshBarbadosBelarusBelgiumBelizeBeninBhutanBoliviaBosnia and HerzegovinaBotswanaBrazilBrunei DarussalamBulgariaCabo VerdeCambodiaCameroonCanadaCaribbean small statesCentral Europe and the BalticsChileChinaColombiaComorosCongo, Dem. Rep.Congo, Rep.Costa RicaCote d'IvoireCroatiaCubaCuracaoCyprusCzech RepublicDenmarkDjiboutiDominicaDominican RepublicEarly-demographic dividendEast Asia & PacificEast Asia & Pacific (excluding high income)East Asia & Pacific (IDA & IBRD countries)EcuadorEgypt, Arab Rep.El SalvadorEquatorial GuineaEritreaEstoniaEthiopiaEuro areaEurope & Central AsiaEurope & Central Asia (excluding high income)Europe & Central Asia (IDA & IBRD countries)European UnionFijiFinlandFragile and conflict affected situationsFranceGabonGambia, TheGeorgiaGermanyGhanaGibraltarGreeceGrenadaGuatemalaGuinea-BissauGuyanaHaitiHeavily indebted poor countries (HIPC)High incomeHondurasHong Kong SAR, ChinaHungaryIBRD onlyIcelandIDA & IBRD totalIDA blendIDA onlyIDA totalIndiaIndonesiaIran, Islamic Rep.IraqIrelandIsraelItalyJamaicaJapanJordanKazakhstanKenyaKiribatiKorea, Dem. People’s Rep.Korea, Rep.KuwaitKyrgyz RepublicLate-demographic dividendLatin America & Caribbean Latin America & Caribbean (excluding high income)Latin America & the Caribbean (IDA & IBRD countries)LatviaLeast developed countries: UN classificationLebanonLesothoLibyaLithuaniaLow & middle incomeLow incomeLower middle incomeLuxembourgMacedonia, FYRMalaysiaMaldivesMaltaMarshall IslandsMauritiusMexicoMiddle East & North AfricaMiddle East & North Africa (excluding high income)Middle East & North Africa (IDA & IBRD countries)Middle incomeMoldovaMongoliaMontenegroMoroccoMozambiqueMyanmarNamibiaNepalNetherlandsNew ZealandNicaraguaNigerNigeriaNorth AmericaNorwayOECD membersOmanOther small statesPacific island small statesPakistanPalauPanamaParaguayPeruPhilippinesPolandPortugalPost-demographic dividendPre-demographic dividendQatarRomaniaRussian FederationSamoaSao Tome and PrincipeSaudi ArabiaSenegalSerbiaSeychellesSingaporeSlovak RepublicSloveniaSmall statesSolomon IslandsSouth AfricaSouth AsiaSouth Asia (IDA & IBRD)South SudanSpainSri LankaSt. Kitts and NevisSt. LuciaSt. Vincent and the GrenadinesSub-Saharan Africa Sub-Saharan Africa (excluding high income)Sub-Saharan Africa (IDA & IBRD countries)SudanSurinameSwazilandSwedenSwitzerlandSyrian Arab RepublicTajikistanTanzaniaThailandTimor-LesteTogoTongaTrinidad and TobagoTunisiaTurkeyTurkmenistanUkraineUnited Arab EmiratesUnited KingdomUnited StatesUpper middle incomeUruguayUzbekistanVanuatuVenezuela, RBVietnamWorldYemen, Rep.ZambiaZimbabwe Timeline:
This timeline shows a graph from 1961 to 2014 of United States. No data until 1960. Number of actual observations by date: 54.
Source name:
World Development Indicators
Source organization:
Carbon Dioxide Information Analysis Center, Environmental Sciences Division, Oak Ridge National Laboratory, Tennessee, United States.
Categories, topics:
Climate Change, Environment
Last updated:
apr 23, 2017
Indicators value changes by year
At the date of observation
Value
Absolute change
Change from previous value
jan 1, 1961
2.836
+2.836
0.0%
jan 1, 1962
2.794
-0.042
-1.47%
jan 1, 1963
2.773
-0.021
-0.75%
jan 1, 1964
2.753
-0.02
-0.72%
jan 1, 1965
2.765
+0.012
0.43%
jan 1, 1966
2.767
+0.002
0.06%
jan 1, 1967
2.749
-0.017
-0.63%
jan 1, 1968
2.731
-0.018
-0.66%
jan 1, 1969
2.699
-0.032
-1.19%
jan 1, 1970
2.708
+0.01
0.35%
jan 1, 1971
2.789
+0.081
2.99%
jan 1, 1972
2.744
-0.045
-1.6%
jan 1, 1973
2.739
-0.006
-0.21%
jan 1, 1974
2.757
+0.019
0.68%
jan 1, 1975
2.719
-0.039
-1.41%
jan 1, 1976
2.665
-0.054
-1.98%
jan 1, 1977
2.612
-0.053
-1.99%
jan 1, 1978
2.599
-0.013
-0.5%
jan 1, 1979
2.604
+0.005
0.2%
jan 1, 1980
2.616
+0.012
0.45%
jan 1, 1981
2.617
+0.002
0.06%
jan 1, 1982
2.585
-0.032
-1.24%
jan 1, 1983
2.561
-0.024
-0.92%
jan 1, 1984
2.58
+0.019
0.73%
jan 1, 1985
2.55
-0.03
-1.17%
jan 1, 1986
2.532
-0.017
-0.67%
jan 1, 1987
2.538
+0.006
0.22%
jan 1, 1988
2.539
+0.001
0.03%
jan 1, 1989
2.549
+0.01
0.41%
jan 1, 1990
2.544
-0.005
-0.19%
jan 1, 1991
2.519
-0.026
-1.01%
jan 1, 1992
2.498
-0.021
-0.83%
jan 1, 1993
2.494
-0.004
-0.16%
jan 1, 1994
2.512
+0.018
0.72%
jan 1, 1995
2.498
-0.014
-0.56%
jan 1, 1996
2.485
-0.012
-0.49%
jan 1, 1997
2.489
+0.004
0.16%
jan 1, 1998
2.518
+0.029
1.16%
jan 1, 1999
2.514
-0.005
-0.19%
jan 1, 2000
2.492
-0.021
-0.84%
jan 1, 2001
2.508
+0.016
0.63%
jan 1, 2002
2.511
+0.003
0.12%
jan 1, 2003
2.504
-0.007
-0.28%
jan 1, 2004
2.512
+0.008
0.31%
jan 1, 2005
2.497
-0.014
-0.57%
jan 1, 2006
2.499
+0.002
0.07%
jan 1, 2007
2.483
-0.016
-0.63%
jan 1, 2008
2.48
-0.004
-0.15%
jan 1, 2009
2.469
-0.01
-0.42%
jan 1, 2010
2.436
-0.033
-1.33%
jan 1, 2011
2.441
+0.005
0.21%
jan 1, 2012
2.421
-0.02
-0.83%
jan 1, 2013
2.391
-0.03
-1.26%
jan 1, 2014
2.37
-0.021
-0.87%
Ranking of countries by current statistics by years


Comments: