29
/
en
AIzaSyAYiBZKx7MnpbEhh9jyipgxe19OcubqV5w
April 1, 2024
71204
Armenia
ARM
true
2
1
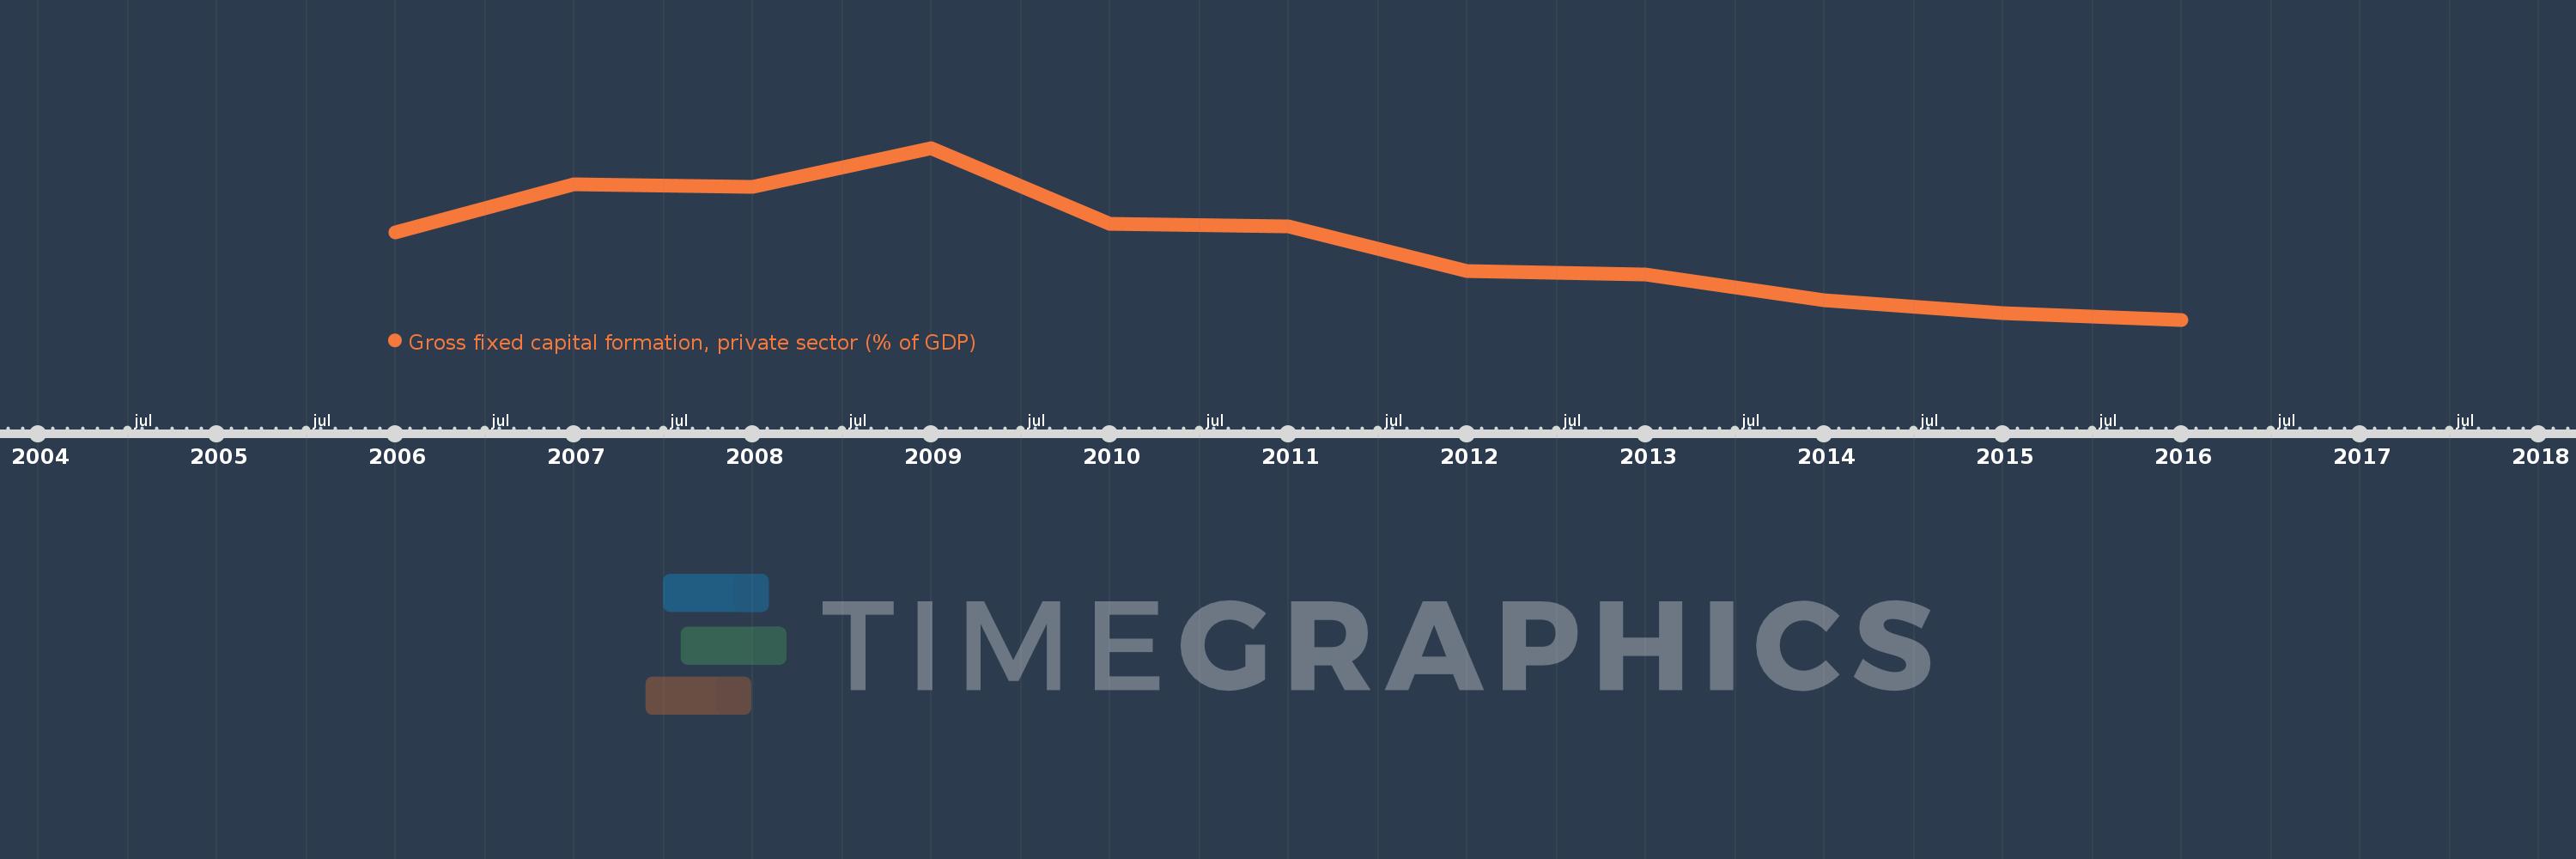
Gross fixed capital formation, private sector (% of GDP)
2016,2015,2014,2013,2012,2011,2010,2009,2008,2007,2006
This statistics in other country:
Timeline:
This timeline shows a graph from 2006 to 2016 of Armenia. No data until 2005. Number of actual observations by date: 11.
Source name:
World Development Indicators
Source organization:
World Bank national accounts data, and OECD National Accounts data files.
Categories, topics:
Economy & Growth
Last updated:
apr 23, 2017
Indicators value changes by year
Minimum:
17.363
jan 1, 2016
Maximum:
35.779
jan 1, 2009
At the date of observation
Value
Absolute change
Change from previous value
jan 1, 2006
26.768
+26.768
0.0%
jan 1, 2007
31.889
+5.121
19.13%
jan 1, 2008
31.564
-0.325
-1.02%
jan 1, 2009
35.779
+4.215
13.35%
jan 1, 2010
27.622
-8.157
-22.8%
jan 1, 2011
27.328
-0.295
-1.07%
jan 1, 2012
22.577
-4.751
-17.39%
jan 1, 2013
22.206
-0.371
-1.64%
jan 1, 2014
19.43
-2.776
-12.5%
jan 1, 2015
18.041
-1.389
-7.15%
jan 1, 2016
17.363
-0.678
-3.76%
Ranking of countries by current statistics by years


Comments: