29
/
en
AIzaSyAYiBZKx7MnpbEhh9jyipgxe19OcubqV5w
April 1, 2024
138087
Georgia
GEO
true
2
1
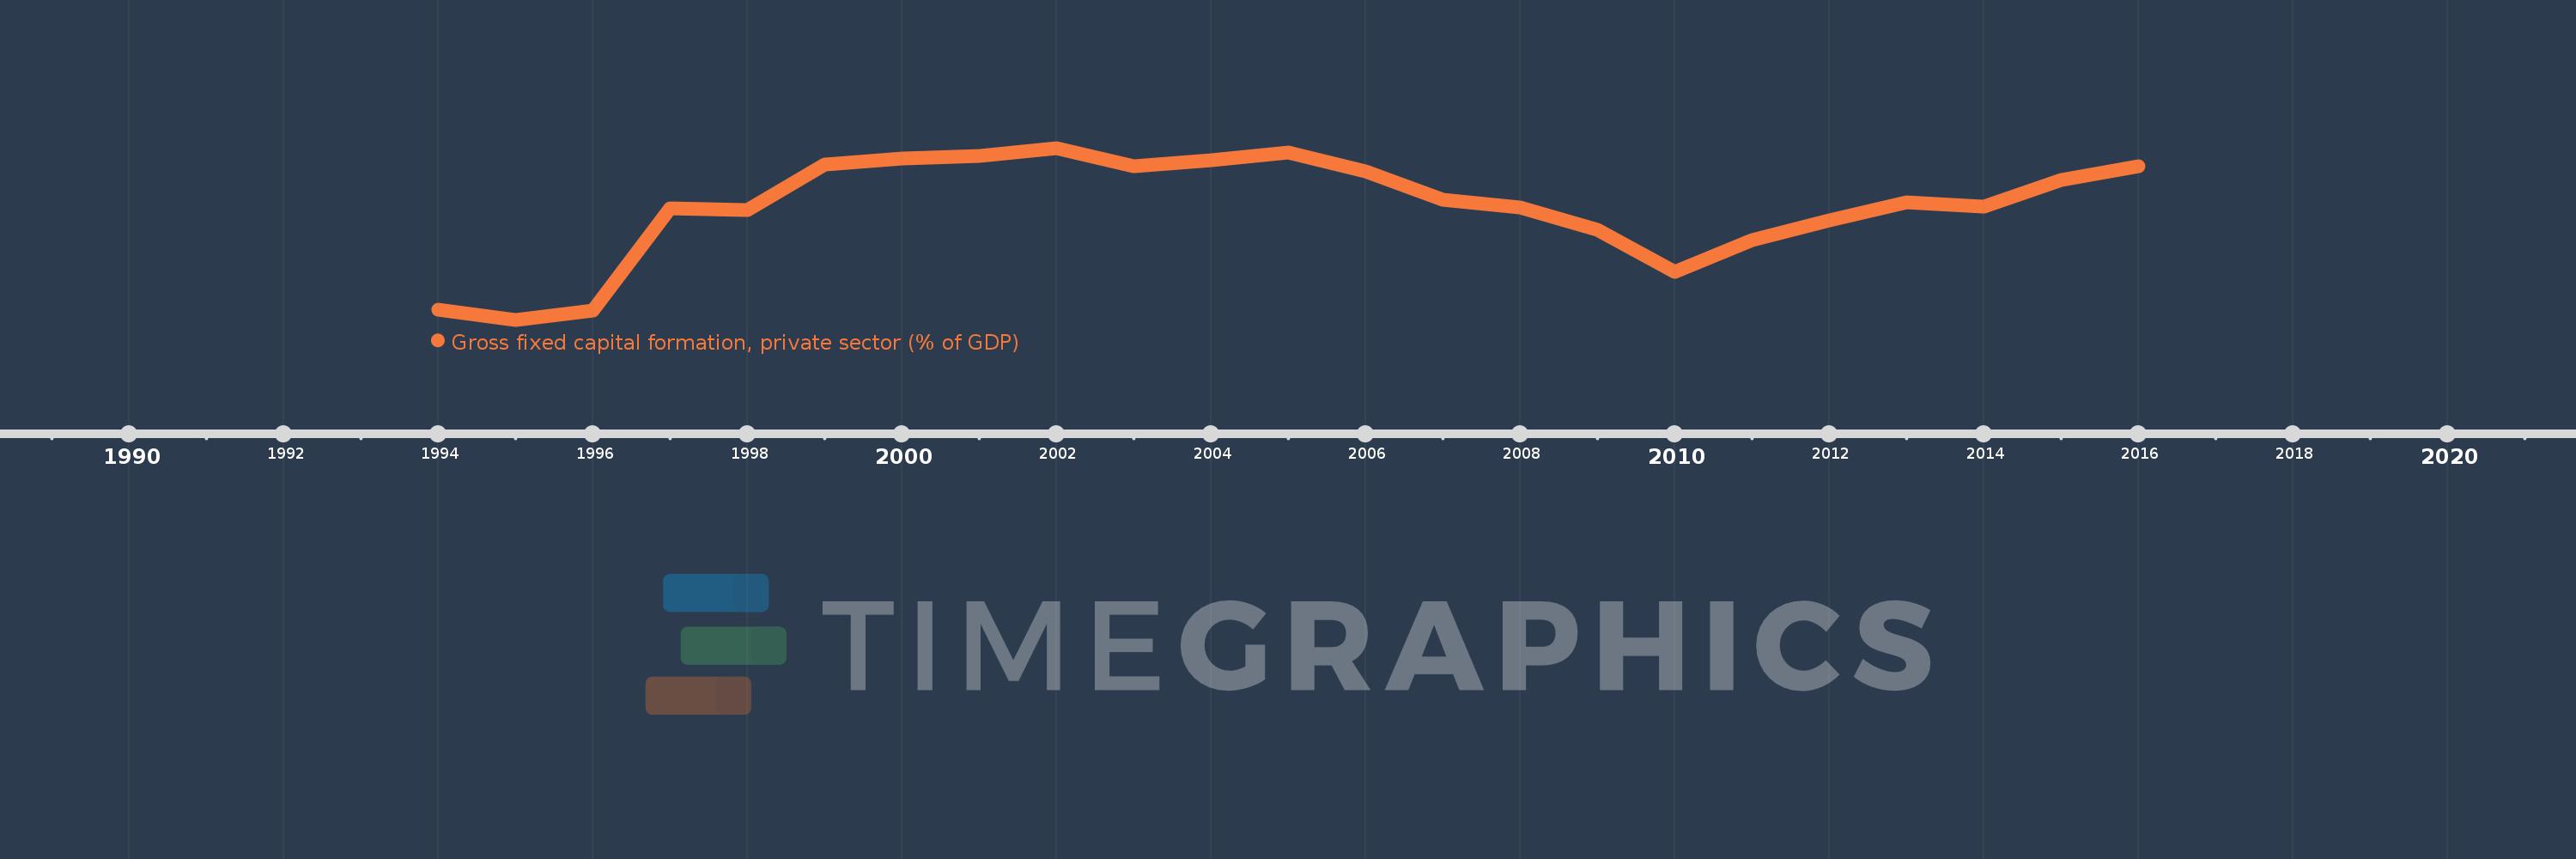
Gross fixed capital formation, private sector (% of GDP)
2016,2015,2014,2013,2012,2011,2010,2009,2008,2007,2006,2005,2004,2003,2002,2001,2000,1999,1998,1997,1996,1995,1994
This statistics in other country:
Timeline:
This timeline shows a graph from 1994 to 2016 of Georgia. No data until 1993. Number of actual observations by date: 23.
Source name:
World Development Indicators
Source organization:
World Bank national accounts data, and OECD National Accounts data files.
Categories, topics:
Economy & Growth
Last updated:
apr 23, 2017
Indicators value changes by year
Maximum:
25.685
jan 1, 2002
At the date of observation
Value
Absolute change
Change from previous value
jan 1, 1994
1.459
+1.459
0.0%
jan 1, 1995
0.0
-1.459
-100.0%
jan 1, 1996
1.315
+1.315
%
jan 1, 1997
16.676
+15.361
1.17K%
jan 1, 1998
16.441
-0.235
-1.41%
jan 1, 1999
23.229
+6.788
41.29%
jan 1, 2000
24.084
+0.855
3.68%
jan 1, 2001
24.548
+0.464
1.93%
jan 1, 2002
25.685
+1.137
4.63%
jan 1, 2003
22.895
-2.79
-10.86%
jan 1, 2004
23.832
+0.937
4.09%
jan 1, 2005
25.054
+1.222
5.13%
jan 1, 2006
22.173
-2.881
-11.5%
jan 1, 2007
17.97
-4.202
-18.95%
jan 1, 2008
16.768
-1.202
-6.69%
jan 1, 2009
13.495
-3.273
-19.52%
jan 1, 2010
7.115
-6.38
-47.28%
jan 1, 2011
11.901
+4.786
67.26%
jan 1, 2012
14.81
+2.908
24.44%
jan 1, 2013
17.505
+2.695
18.2%
jan 1, 2014
16.87
-0.635
-3.62%
jan 1, 2015
20.894
+4.024
23.85%
jan 1, 2016
22.895
+2.0
9.57%
Ranking of countries by current statistics by years


Comments: