29
/
en
AIzaSyAYiBZKx7MnpbEhh9jyipgxe19OcubqV5w
April 1, 2024
150438
Honduras
HND
true
2
1
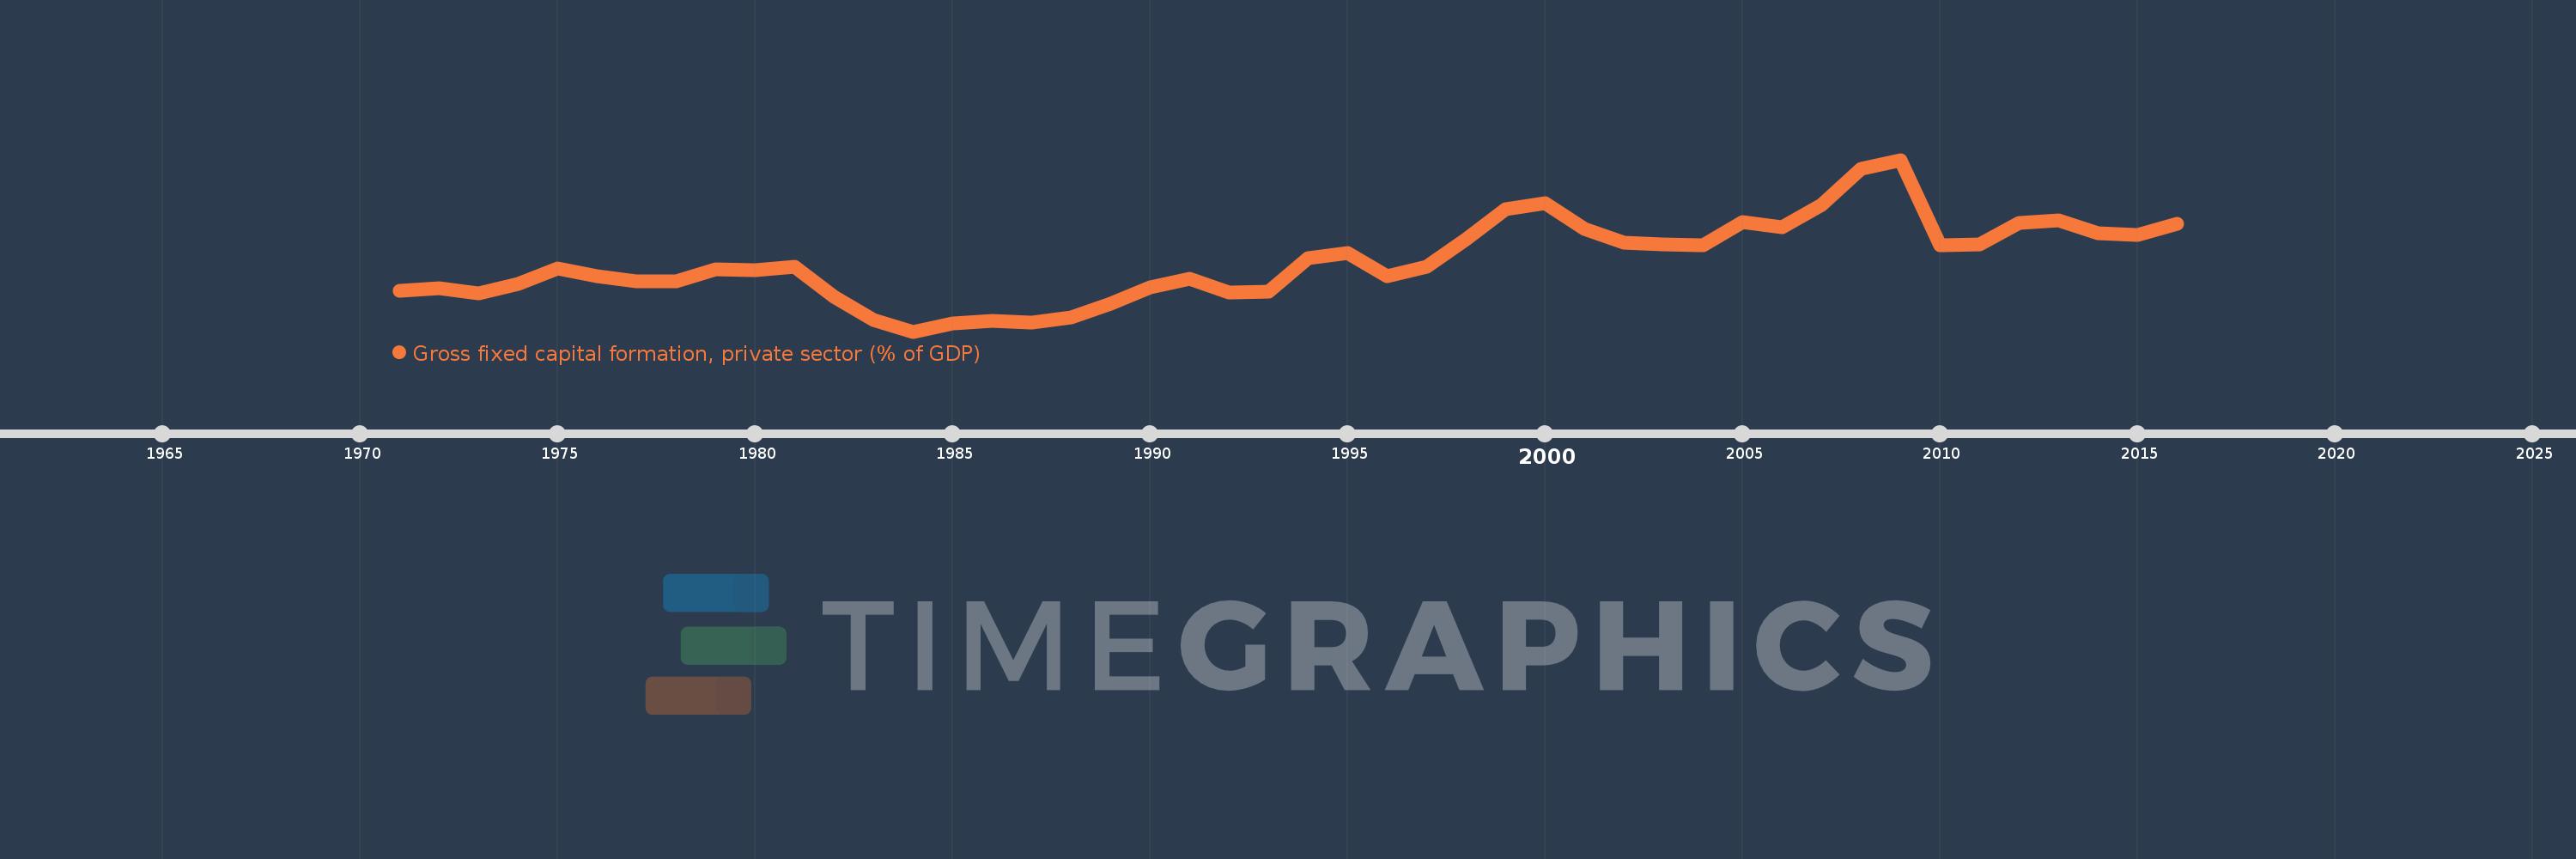
Gross fixed capital formation, private sector (% of GDP)
2016,2015,2014,2013,2012,2011,2010,2009,2008,2007,2006,2005,2004,2003,2002,2001,2000,1999,1998,1997,1996,1995,1994,1993,1992,1991,1990,1989,1988,1987,1986,1985,1984,1983,1982,1981,1980,1979,1978,1977,1976,1975,1974,1973,1972,1971
This statistics in other country:
Timeline:
This timeline shows a graph from 1971 to 2016 of Honduras. No data until 1970. Number of actual observations by date: 46.
Source name:
World Development Indicators
Source organization:
World Bank national accounts data, and OECD National Accounts data files.
Categories, topics:
Economy & Growth
Last updated:
apr 23, 2017
Indicators value changes by year
At the date of observation
Value
Absolute change
Change from previous value
jan 1, 1971
12.033
+12.033
0.0%
jan 1, 1972
12.449
+0.416
3.45%
jan 1, 1973
11.706
-0.743
-5.97%
jan 1, 1974
12.986
+1.28
10.94%
jan 1, 1975
15.031
+2.045
15.75%
jan 1, 1976
13.968
-1.063
-7.07%
jan 1, 1977
13.353
-0.615
-4.4%
jan 1, 1978
13.327
-0.026
-0.19%
jan 1, 1979
14.952
+1.625
12.19%
jan 1, 1980
14.79
-0.162
-1.08%
jan 1, 1981
15.218
+0.428
2.89%
jan 1, 1982
11.243
-3.975
-26.12%
jan 1, 1983
8.231
-3.012
-26.79%
jan 1, 1984
6.679
-1.553
-18.86%
jan 1, 1985
7.743
+1.065
15.94%
jan 1, 1986
8.064
+0.321
4.15%
jan 1, 1987
7.851
-0.213
-2.65%
jan 1, 1988
8.513
+0.662
8.43%
jan 1, 1989
10.399
+1.886
22.15%
jan 1, 1990
12.531
+2.133
20.51%
jan 1, 1991
13.64
+1.108
8.84%
jan 1, 1992
11.818
-1.822
-13.35%
jan 1, 1993
11.989
+0.171
1.45%
jan 1, 1994
16.356
+4.367
36.42%
jan 1, 1995
17.005
+0.649
3.97%
jan 1, 1996
13.963
-3.042
-17.89%
jan 1, 1997
15.231
+1.269
9.09%
jan 1, 1998
18.873
+3.641
23.91%
jan 1, 1999
22.826
+3.953
20.95%
jan 1, 2000
23.595
+0.77
3.37%
jan 1, 2001
20.281
-3.314
-14.05%
jan 1, 2002
18.46
-1.821
-8.98%
jan 1, 2003
18.136
-0.325
-1.76%
jan 1, 2004
18.036
-0.1
-0.55%
jan 1, 2005
21.125
+3.089
17.13%
jan 1, 2006
20.443
-0.682
-3.23%
jan 1, 2007
23.371
+2.929
14.33%
jan 1, 2008
28.148
+4.777
20.44%
jan 1, 2009
29.35
+1.202
4.27%
jan 1, 2010
18.032
-11.317
-38.56%
jan 1, 2011
18.234
+0.202
1.12%
jan 1, 2012
21.059
+2.825
15.49%
jan 1, 2013
21.414
+0.355
1.68%
jan 1, 2014
19.7
-1.714
-8.0%
jan 1, 2015
19.446
-0.254
-1.29%
jan 1, 2016
20.876
+1.431
7.36%
Ranking of countries by current statistics by years


Comments: