29
/
en
AIzaSyAYiBZKx7MnpbEhh9jyipgxe19OcubqV5w
April 1, 2024
64776
Albania
ALB
true
2
1
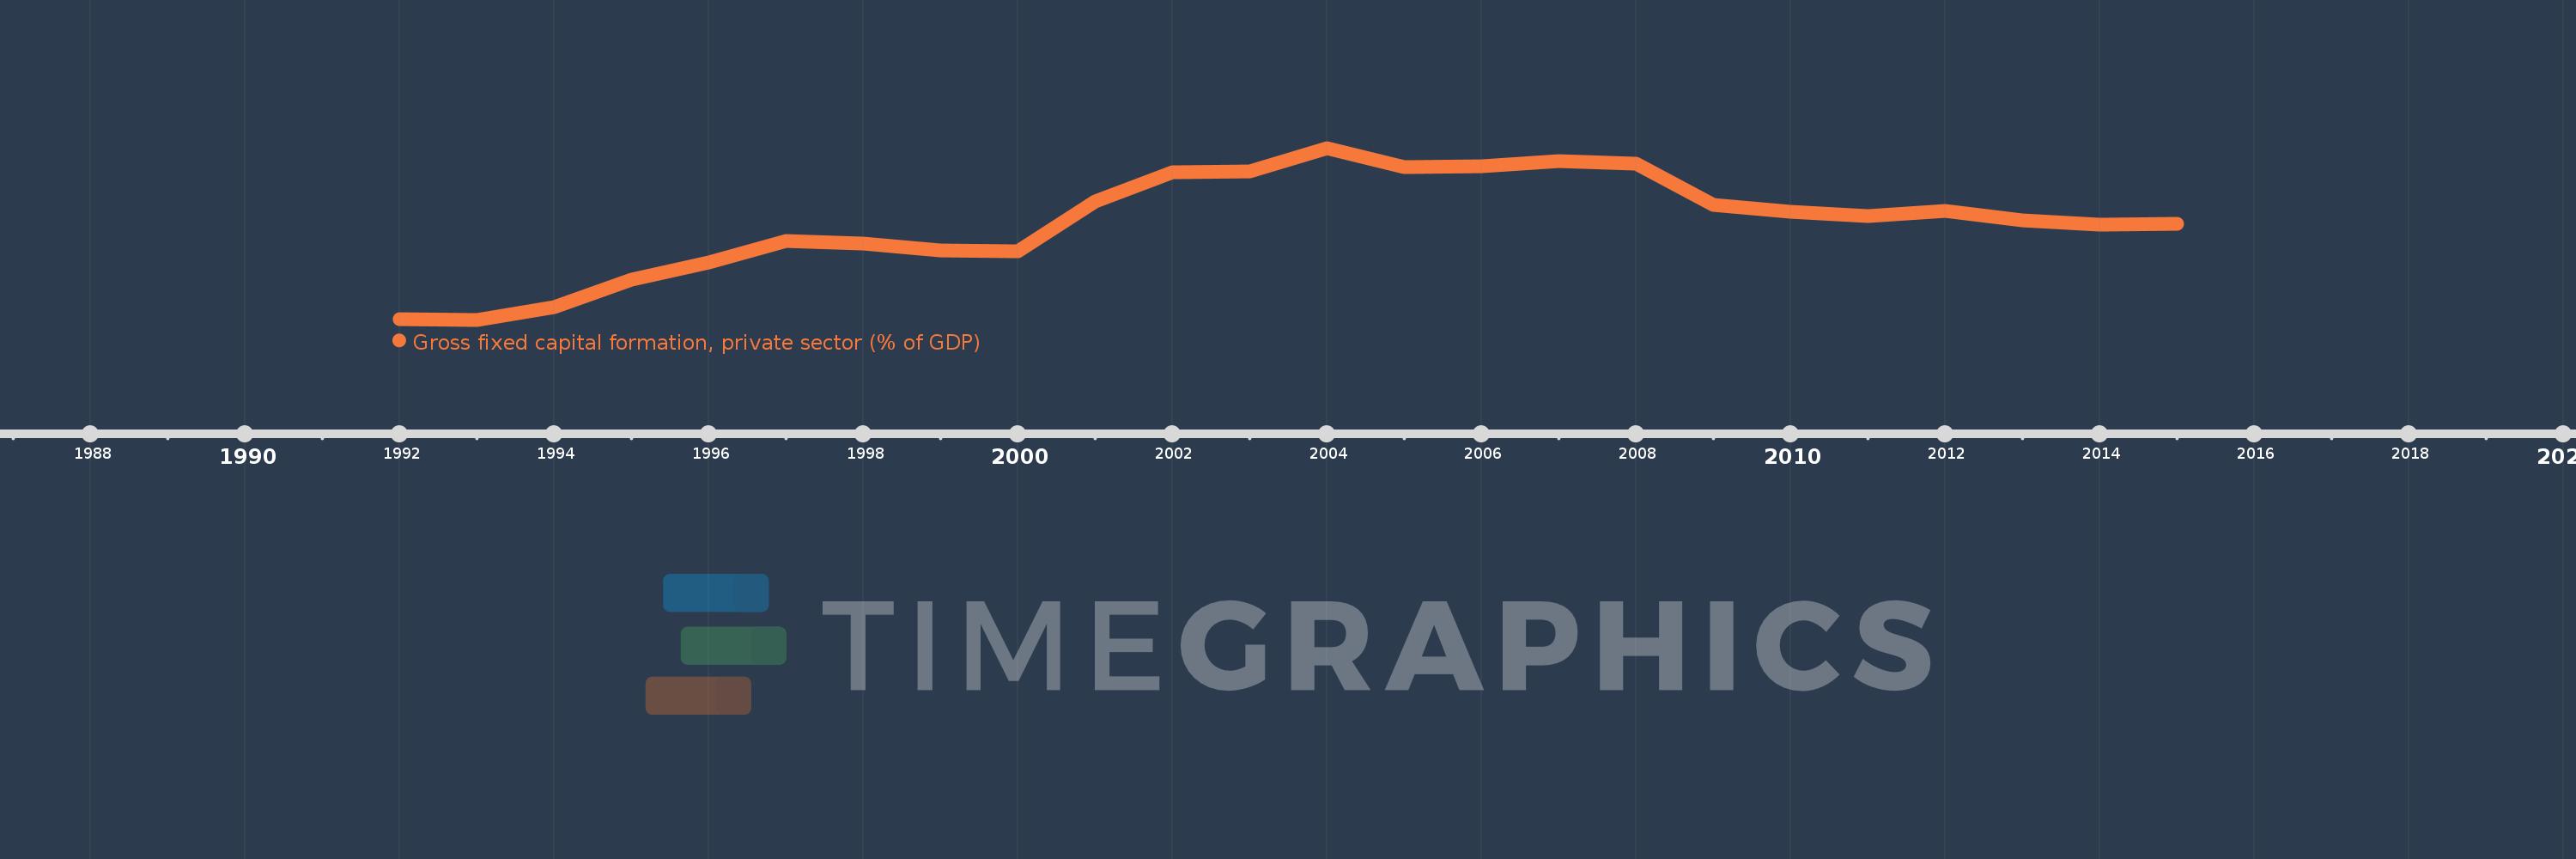
Gross fixed capital formation, private sector (% of GDP)
2015,2014,2013,2012,2011,2010,2009,2008,2007,2006,2005,2004,2003,2002,2001,2000,1999,1998,1997,1996,1995,1994,1993,1992
This statistics in other country:
Timeline:
This timeline shows a graph from 1992 to 2015 of Albania. No data until 1991. Number of actual observations by date: 24.
Source name:
World Development Indicators
Source organization:
World Bank national accounts data, and OECD National Accounts data files.
Categories, topics:
Economy & Growth
Last updated:
apr 23, 2017
Indicators value changes by year
Maximum:
35.939
jan 1, 2004
At the date of observation
Value
Absolute change
Change from previous value
jan 1, 1993
1.154
-0.046
-3.87%
jan 1, 1994
3.743
+2.59
224.5%
jan 1, 1995
9.313
+5.57
148.79%
jan 1, 1996
12.8
+3.487
37.44%
jan 1, 1997
17.064
+4.264
33.31%
jan 1, 1998
16.519
-0.545
-3.19%
jan 1, 1999
15.21
-1.309
-7.92%
jan 1, 2000
15.097
-0.113
-0.74%
jan 1, 2001
25.031
+9.934
65.8%
jan 1, 2002
30.985
+5.954
23.79%
jan 1, 2003
31.219
+0.235
0.76%
jan 1, 2004
35.939
+4.719
15.12%
jan 1, 2005
32.06
-3.879
-10.79%
jan 1, 2006
32.272
+0.212
0.66%
jan 1, 2007
33.267
+0.994
3.08%
jan 1, 2008
32.761
-0.506
-1.52%
jan 1, 2009
24.395
-8.367
-25.54%
jan 1, 2010
23.074
-1.321
-5.42%
jan 1, 2011
22.099
-0.975
-4.23%
jan 1, 2012
23.244
+1.145
5.18%
jan 1, 2013
21.364
-1.879
-8.09%
jan 1, 2014
20.382
-0.983
-4.6%
jan 1, 2015
20.643
+0.261
1.28%
Ranking of countries by current statistics by years


Comments: