29
/
en
AIzaSyAYiBZKx7MnpbEhh9jyipgxe19OcubqV5w
April 1, 2024
39032
IDA only
IDX
false
2
1
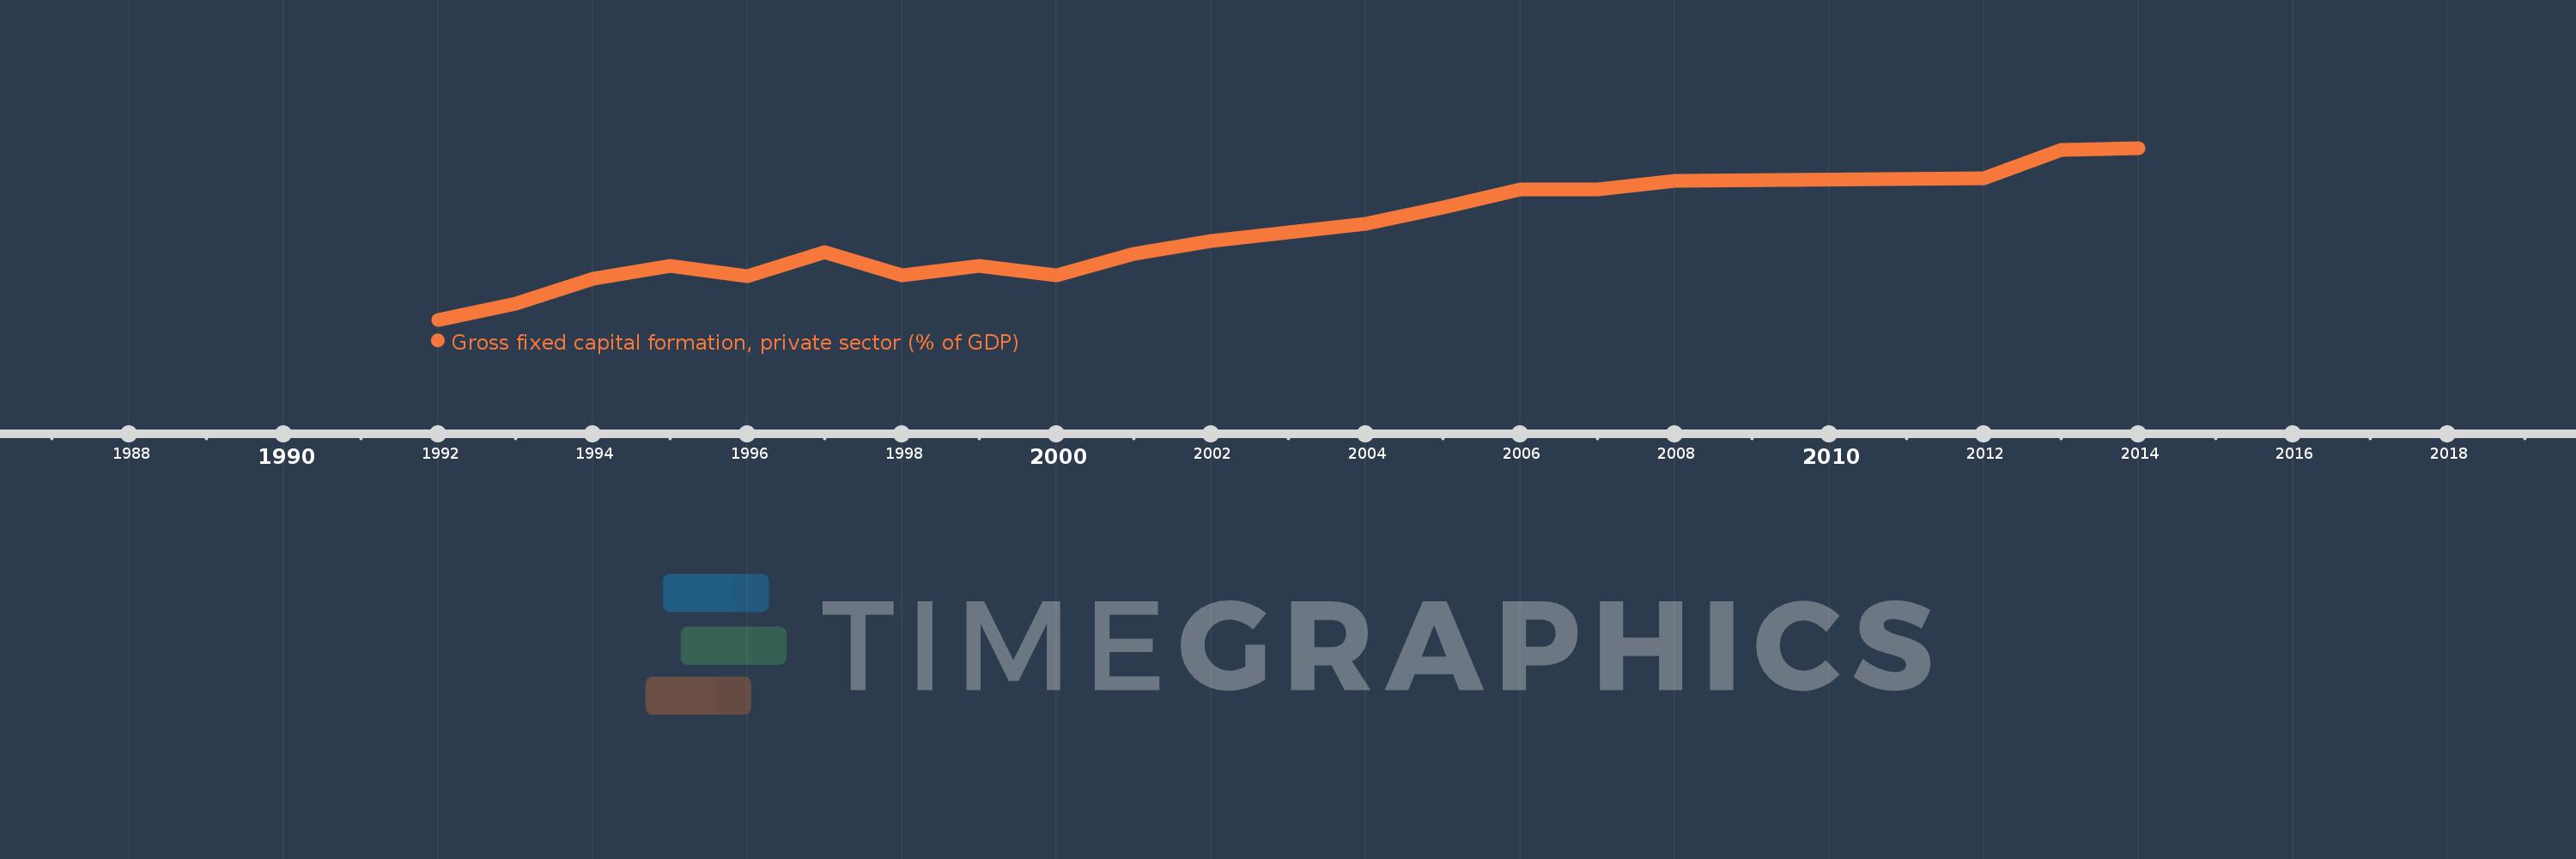
Gross fixed capital formation, private sector (% of GDP)
2014,2013,2012,2008,2007,2006,2005,2004,2003,2002,2001,2000,1999,1998,1997,1996,1995,1994,1993,1992
This statistics in other country:
Timeline:
This timeline shows a graph from 1992 to 2014 of IDA only. No data until 1991. Number of actual observations by date: 20.
Source name:
World Development Indicators
Source organization:
World Bank national accounts data, and OECD National Accounts data files.
Categories, topics:
Economy & Growth
Last updated:
apr 23, 2017
Indicators value changes by year
Maximum:
17.547
jan 1, 2014
At the date of observation
Value
Absolute change
Change from previous value
jan 1, 1992
9.468
+9.468
0.0%
jan 1, 1993
10.218
+0.751
7.93%
jan 1, 1994
11.384
+1.165
11.4%
jan 1, 1995
11.981
+0.598
5.25%
jan 1, 1996
11.508
-0.473
-3.95%
jan 1, 1997
12.636
+1.128
9.8%
jan 1, 1998
11.55
-1.085
-8.59%
jan 1, 1999
12.01
+0.459
3.98%
jan 1, 2000
11.558
-0.452
-3.76%
jan 1, 2001
12.551
+0.993
8.59%
jan 1, 2002
13.167
+0.616
4.91%
jan 1, 2003
13.575
+0.408
3.1%
jan 1, 2004
13.969
+0.393
2.9%
jan 1, 2005
14.732
+0.764
5.47%
jan 1, 2006
15.612
+0.879
5.97%
jan 1, 2007
15.596
-0.016
-0.1%
jan 1, 2008
15.998
+0.402
2.58%
jan 1, 2012
16.102
+0.104
0.65%
jan 1, 2013
17.442
+1.34
8.32%
jan 1, 2014
17.547
+0.105
0.6%
Ranking of countries by current statistics by years


Comments: