29
/
en
AIzaSyAYiBZKx7MnpbEhh9jyipgxe19OcubqV5w
April 1, 2024
43474
Latin America & the Caribbean (IDA & IBRD countries)
TLA
false
2
1
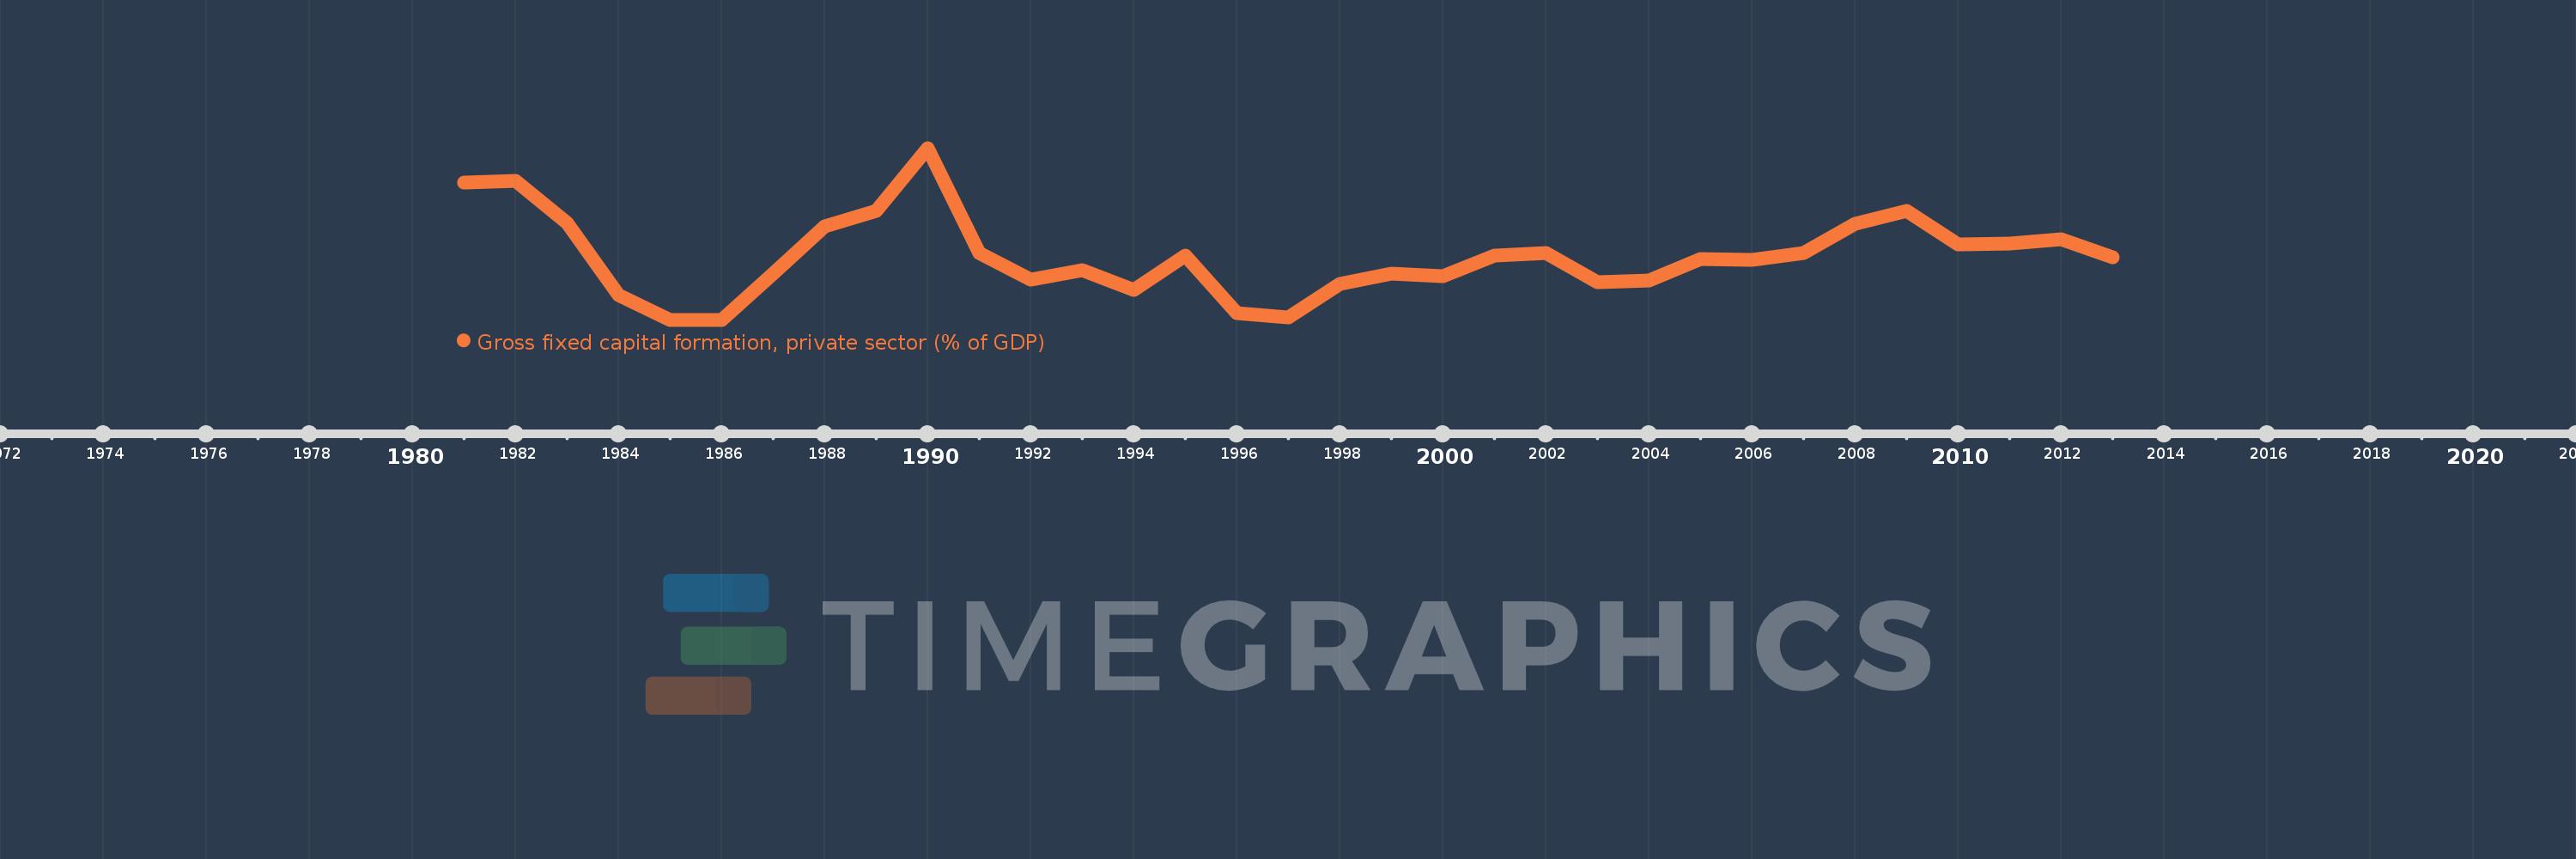
Gross fixed capital formation, private sector (% of GDP)
2013,2012,2011,2010,2009,2008,2007,2006,2005,2004,2003,2002,2001,2000,1999,1998,1997,1996,1995,1994,1993,1992,1991,1990,1989,1988,1987,1986,1985,1984,1983,1982,1981
This statistics in other country:
Timeline:
This timeline shows a graph from 1981 to 2013 of Latin America & the Caribbean (IDA & IBRD countries). No data until 1980. Number of actual observations by date: 33.
Source name:
World Development Indicators
Source organization:
World Bank national accounts data, and OECD National Accounts data files.
Categories, topics:
Economy & Growth
Last updated:
apr 23, 2017
Indicators value changes by year
Minimum:
13.023
jan 1, 1986
Maximum:
18.099
jan 1, 1990
At the date of observation
Value
Absolute change
Change from previous value
jan 1, 1981
17.071
+17.071
0.0%
jan 1, 1982
17.117
+0.046
0.27%
jan 1, 1983
15.876
-1.24
-7.25%
jan 1, 1984
13.754
-2.123
-13.37%
jan 1, 1985
13.026
-0.728
-5.29%
jan 1, 1986
13.023
-0.003
-0.02%
jan 1, 1987
14.379
+1.356
10.41%
jan 1, 1988
15.784
+1.405
9.77%
jan 1, 1989
16.234
+0.45
2.85%
jan 1, 1990
18.099
+1.865
11.49%
jan 1, 1991
14.989
-3.111
-17.19%
jan 1, 1992
14.205
-0.783
-5.23%
jan 1, 1993
14.491
+0.285
2.01%
jan 1, 1994
13.897
-0.594
-4.1%
jan 1, 1995
14.915
+1.018
7.33%
jan 1, 1996
13.212
-1.703
-11.42%
jan 1, 1997
13.085
-0.127
-0.96%
jan 1, 1998
14.09
+1.004
7.68%
jan 1, 1999
14.378
+0.288
2.04%
jan 1, 2000
14.298
-0.08
-0.56%
jan 1, 2001
14.914
+0.616
4.31%
jan 1, 2002
14.994
+0.08
0.54%
jan 1, 2003
14.138
-0.857
-5.71%
jan 1, 2004
14.172
+0.034
0.24%
jan 1, 2005
14.819
+0.647
4.56%
jan 1, 2006
14.797
-0.022
-0.15%
jan 1, 2007
15.002
+0.205
1.38%
jan 1, 2008
15.869
+0.867
5.78%
jan 1, 2009
16.248
+0.379
2.39%
jan 1, 2010
15.255
-0.993
-6.11%
jan 1, 2011
15.28
+0.025
0.16%
jan 1, 2012
15.39
+0.111
0.72%
jan 1, 2013
14.866
-0.525
-3.41%
Ranking of countries by current statistics by years


Comments: