29
/
en
AIzaSyAYiBZKx7MnpbEhh9jyipgxe19OcubqV5w
April 1, 2024
176454
Lebanon
LBN
true
2
1
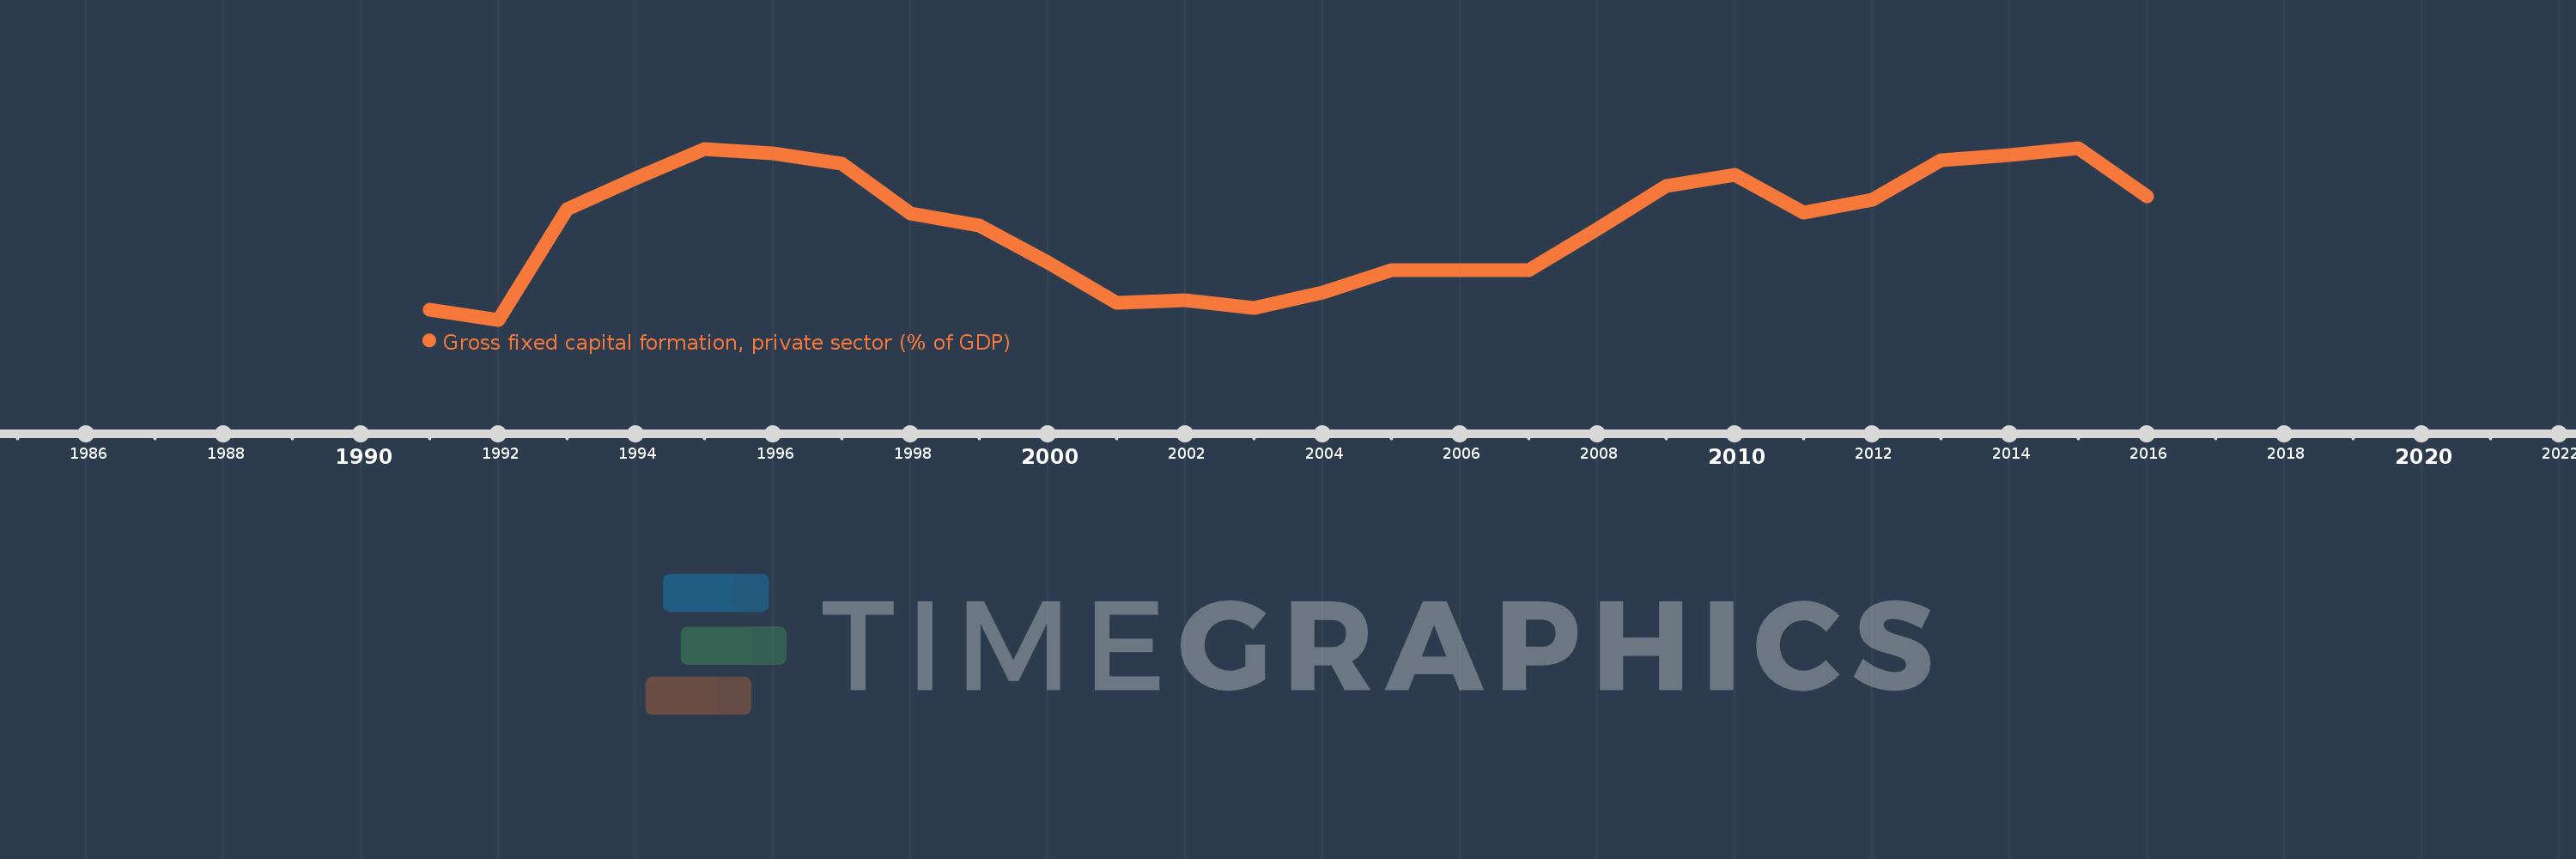
Gross fixed capital formation, private sector (% of GDP)
2016,2015,2014,2013,2012,2011,2010,2009,2008,2007,2006,2005,2004,2003,2002,2001,2000,1999,1998,1997,1996,1995,1994,1993,1992,1991
This statistics in other country:
Timeline:
This timeline shows a graph from 1991 to 2016 of Lebanon. No data until 1990. Number of actual observations by date: 26.
Source name:
World Development Indicators
Source organization:
World Bank national accounts data, and OECD National Accounts data files.
Categories, topics:
Economy & Growth
Last updated:
apr 23, 2017
Indicators value changes by year
Minimum:
15.392
jan 1, 1992
At the date of observation
Value
Absolute change
Change from previous value
jan 1, 1991
16.097
+16.097
0.0%
jan 1, 1992
15.392
-0.705
-4.38%
jan 1, 1993
23.463
+8.071
52.44%
jan 1, 1994
25.709
+2.246
9.57%
jan 1, 1995
27.819
+2.11
8.21%
jan 1, 1996
27.498
-0.321
-1.15%
jan 1, 1997
26.753
-0.745
-2.71%
jan 1, 1998
23.151
-3.602
-13.46%
jan 1, 1999
22.249
-0.901
-3.89%
jan 1, 2000
19.54
-2.709
-12.18%
jan 1, 2001
16.595
-2.945
-15.07%
jan 1, 2002
16.789
+0.194
1.17%
jan 1, 2003
16.279
-0.51
-3.04%
jan 1, 2004
17.348
+1.069
6.57%
jan 1, 2005
19.016
+1.668
9.61%
jan 1, 2006
19.015
-0.001
0.0%
jan 1, 2007
19.009
-0.006
-0.03%
jan 1, 2008
22.022
+3.013
15.85%
jan 1, 2009
25.135
+3.114
14.14%
jan 1, 2010
25.955
+0.82
3.26%
jan 1, 2011
23.171
-2.784
-10.73%
jan 1, 2012
24.113
+0.942
4.07%
jan 1, 2013
27.006
+2.892
12.0%
jan 1, 2014
27.403
+0.397
1.47%
jan 1, 2015
27.91
+0.507
1.85%
jan 1, 2016
24.363
-3.546
-12.71%
Ranking of countries by current statistics by years


Comments: