29
/
en
AIzaSyAYiBZKx7MnpbEhh9jyipgxe19OcubqV5w
April 1, 2024
216490
Pakistan
PAK
true
2
1
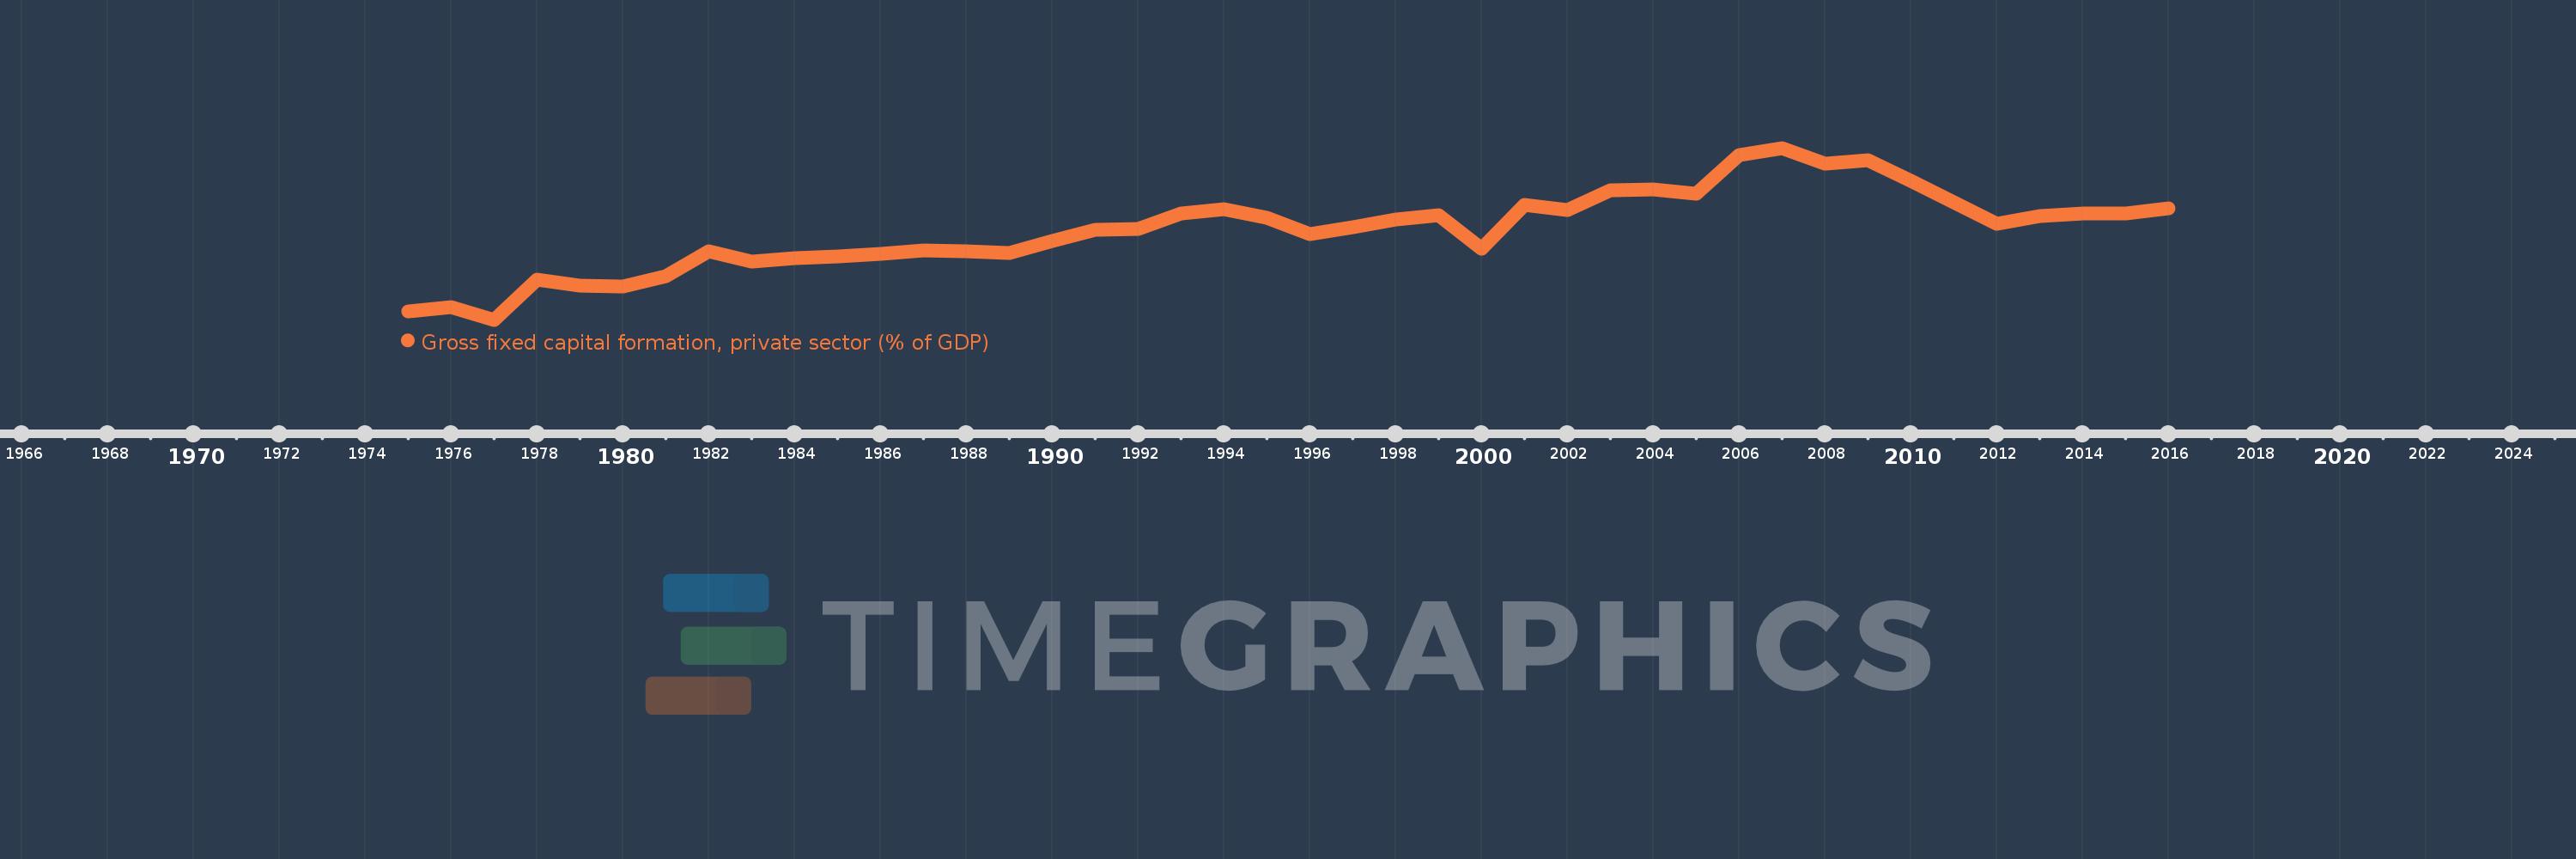
Gross fixed capital formation, private sector (% of GDP)
2016,2015,2014,2013,2012,2011,2010,2009,2008,2007,2006,2005,2004,2003,2002,2001,2000,1999,1998,1997,1996,1995,1994,1993,1992,1991,1990,1989,1988,1987,1986,1985,1984,1983,1982,1981,1980,1979,1978,1977,1976,1975
This statistics in other country:
Timeline:
This timeline shows a graph from 1975 to 2016 of Pakistan. No data until 1974. Number of actual observations by date: 42.
Source name:
World Development Indicators
Source organization:
World Bank national accounts data, and OECD National Accounts data files.
Categories, topics:
Economy & Growth
Last updated:
apr 23, 2017
Indicators value changes by year
At the date of observation
Value
Absolute change
Change from previous value
jan 1, 1975
4.421
+4.421
0.0%
jan 1, 1976
4.638
+0.217
4.9%
jan 1, 1977
3.936
-0.703
-15.15%
jan 1, 1978
6.153
+2.218
56.36%
jan 1, 1979
5.812
-0.341
-5.55%
jan 1, 1980
5.777
-0.036
-0.61%
jan 1, 1981
6.364
+0.587
10.17%
jan 1, 1982
7.757
+1.393
21.89%
jan 1, 1983
7.194
-0.562
-7.25%
jan 1, 1984
7.355
+0.16
2.23%
jan 1, 1985
7.481
+0.126
1.72%
jan 1, 1986
7.599
+0.118
1.57%
jan 1, 1987
7.777
+0.178
2.34%
jan 1, 1988
7.747
-0.03
-0.38%
jan 1, 1989
7.665
-0.082
-1.06%
jan 1, 1990
8.301
+0.635
8.29%
jan 1, 1991
8.942
+0.642
7.73%
jan 1, 1992
8.973
+0.03
0.34%
jan 1, 1993
9.85
+0.877
9.78%
jan 1, 1994
10.093
+0.243
2.46%
jan 1, 1995
9.611
-0.482
-4.78%
jan 1, 1996
8.723
-0.888
-9.24%
jan 1, 1997
9.109
+0.386
4.43%
jan 1, 1998
9.505
+0.397
4.35%
jan 1, 1999
9.765
+0.259
2.73%
jan 1, 2000
7.88
-1.885
-19.3%
jan 1, 2001
10.317
+2.437
30.93%
jan 1, 2002
10.05
-0.267
-2.59%
jan 1, 2003
11.15
+1.1
10.94%
jan 1, 2004
11.18
+0.03
0.27%
jan 1, 2005
10.93
-0.25
-2.24%
jan 1, 2006
13.115
+2.185
19.99%
jan 1, 2007
13.5
+0.386
2.94%
jan 1, 2008
12.633
-0.867
-6.42%
jan 1, 2009
12.821
+0.188
1.49%
jan 1, 2010
11.663
-1.158
-9.03%
jan 1, 2011
10.479
-1.184
-10.15%
jan 1, 2012
9.29
-1.189
-11.35%
jan 1, 2013
9.729
+0.44
4.73%
jan 1, 2014
9.838
+0.109
1.12%
jan 1, 2015
9.869
+0.031
0.31%
jan 1, 2016
10.158
+0.29
2.94%
Ranking of countries by current statistics by years


Comments: