29
/
en
AIzaSyAYiBZKx7MnpbEhh9jyipgxe19OcubqV5w
April 1, 2024
42430
Latin America & Caribbean (excluding high income)
LAC
false
2
1
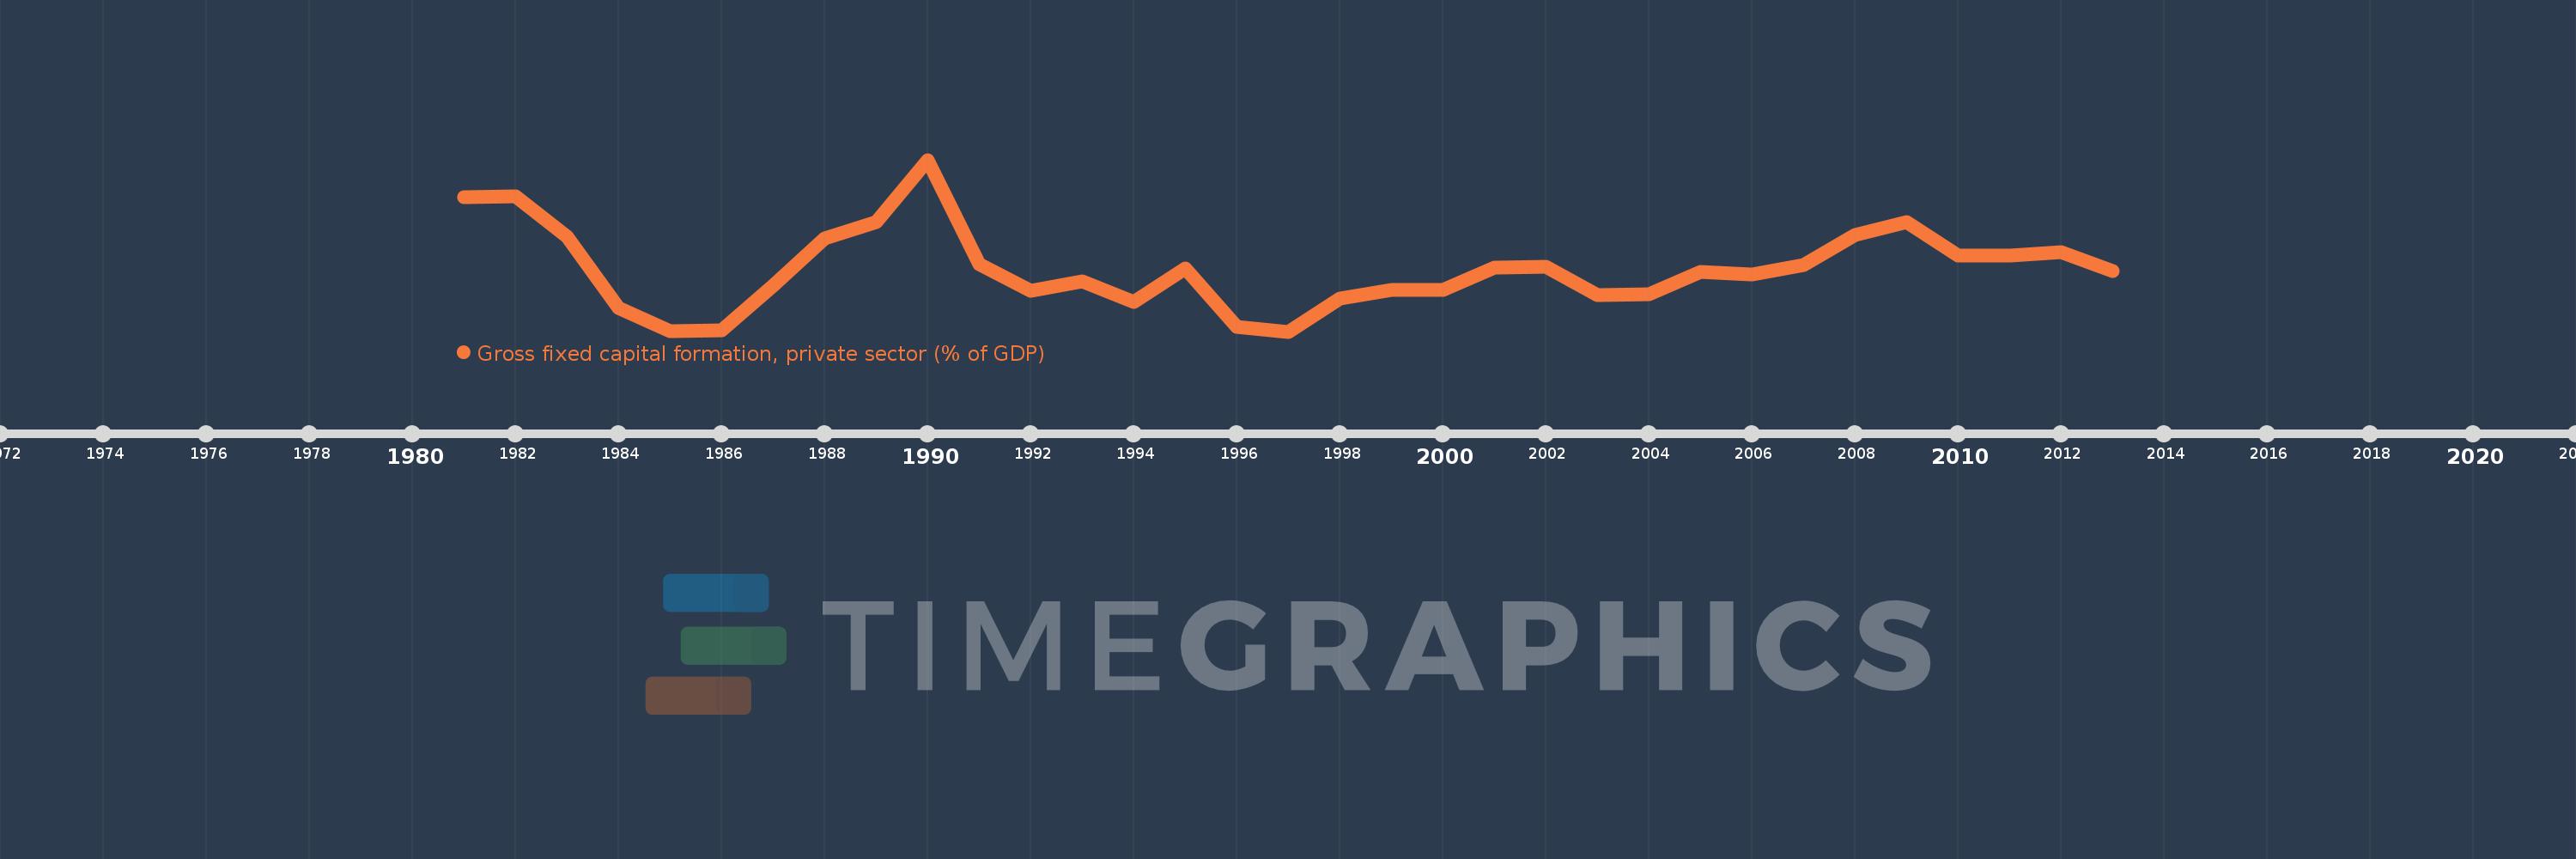
Gross fixed capital formation, private sector (% of GDP)
2013,2012,2011,2010,2009,2008,2007,2006,2005,2004,2003,2002,2001,2000,1999,1998,1997,1996,1995,1994,1993,1992,1991,1990,1989,1988,1987,1986,1985,1984,1983,1982,1981
This statistics in other country:
Timeline:
This timeline shows a graph from 1981 to 2013 of Latin America & Caribbean (excluding high income). No data until 1980. Number of actual observations by date: 33.
Source name:
World Development Indicators
Source organization:
World Bank national accounts data, and OECD National Accounts data files.
Categories, topics:
Economy & Growth
Last updated:
apr 23, 2017
Indicators value changes by year
Minimum:
13.058
jan 1, 1997
Maximum:
18.223
jan 1, 1990
At the date of observation
Value
Absolute change
Change from previous value
jan 1, 1981
17.103
+17.103
0.0%
jan 1, 1982
17.138
+0.035
0.2%
jan 1, 1983
15.906
-1.232
-7.19%
jan 1, 1984
13.781
-2.125
-13.36%
jan 1, 1985
13.074
-0.707
-5.13%
jan 1, 1986
13.085
+0.011
0.08%
jan 1, 1987
14.443
+1.358
10.38%
jan 1, 1988
15.862
+1.419
9.82%
jan 1, 1989
16.35
+0.489
3.08%
jan 1, 1990
18.223
+1.873
11.45%
jan 1, 1991
15.075
-3.148
-17.28%
jan 1, 1992
14.279
-0.796
-5.28%
jan 1, 1993
14.558
+0.279
1.95%
jan 1, 1994
13.951
-0.607
-4.17%
jan 1, 1995
14.959
+1.008
7.22%
jan 1, 1996
13.21
-1.749
-11.69%
jan 1, 1997
13.058
-0.153
-1.15%
jan 1, 1998
14.047
+0.989
7.58%
jan 1, 1999
14.316
+0.269
1.92%
jan 1, 2000
14.32
+0.003
0.02%
jan 1, 2001
14.98
+0.66
4.61%
jan 1, 2002
15.008
+0.028
0.19%
jan 1, 2003
14.156
-0.852
-5.68%
jan 1, 2004
14.179
+0.023
0.16%
jan 1, 2005
14.86
+0.681
4.8%
jan 1, 2006
14.768
-0.092
-0.62%
jan 1, 2007
15.062
+0.294
1.99%
jan 1, 2008
15.963
+0.9
5.98%
jan 1, 2009
16.339
+0.377
2.36%
jan 1, 2010
15.348
-0.991
-6.07%
jan 1, 2011
15.352
+0.004
0.02%
jan 1, 2012
15.446
+0.094
0.61%
jan 1, 2013
14.882
-0.564
-3.65%
Ranking of countries by current statistics by years


Comments: