29
/
en
AIzaSyAYiBZKx7MnpbEhh9jyipgxe19OcubqV5w
April 1, 2024
145729
Guinea
GIN
true
2
1
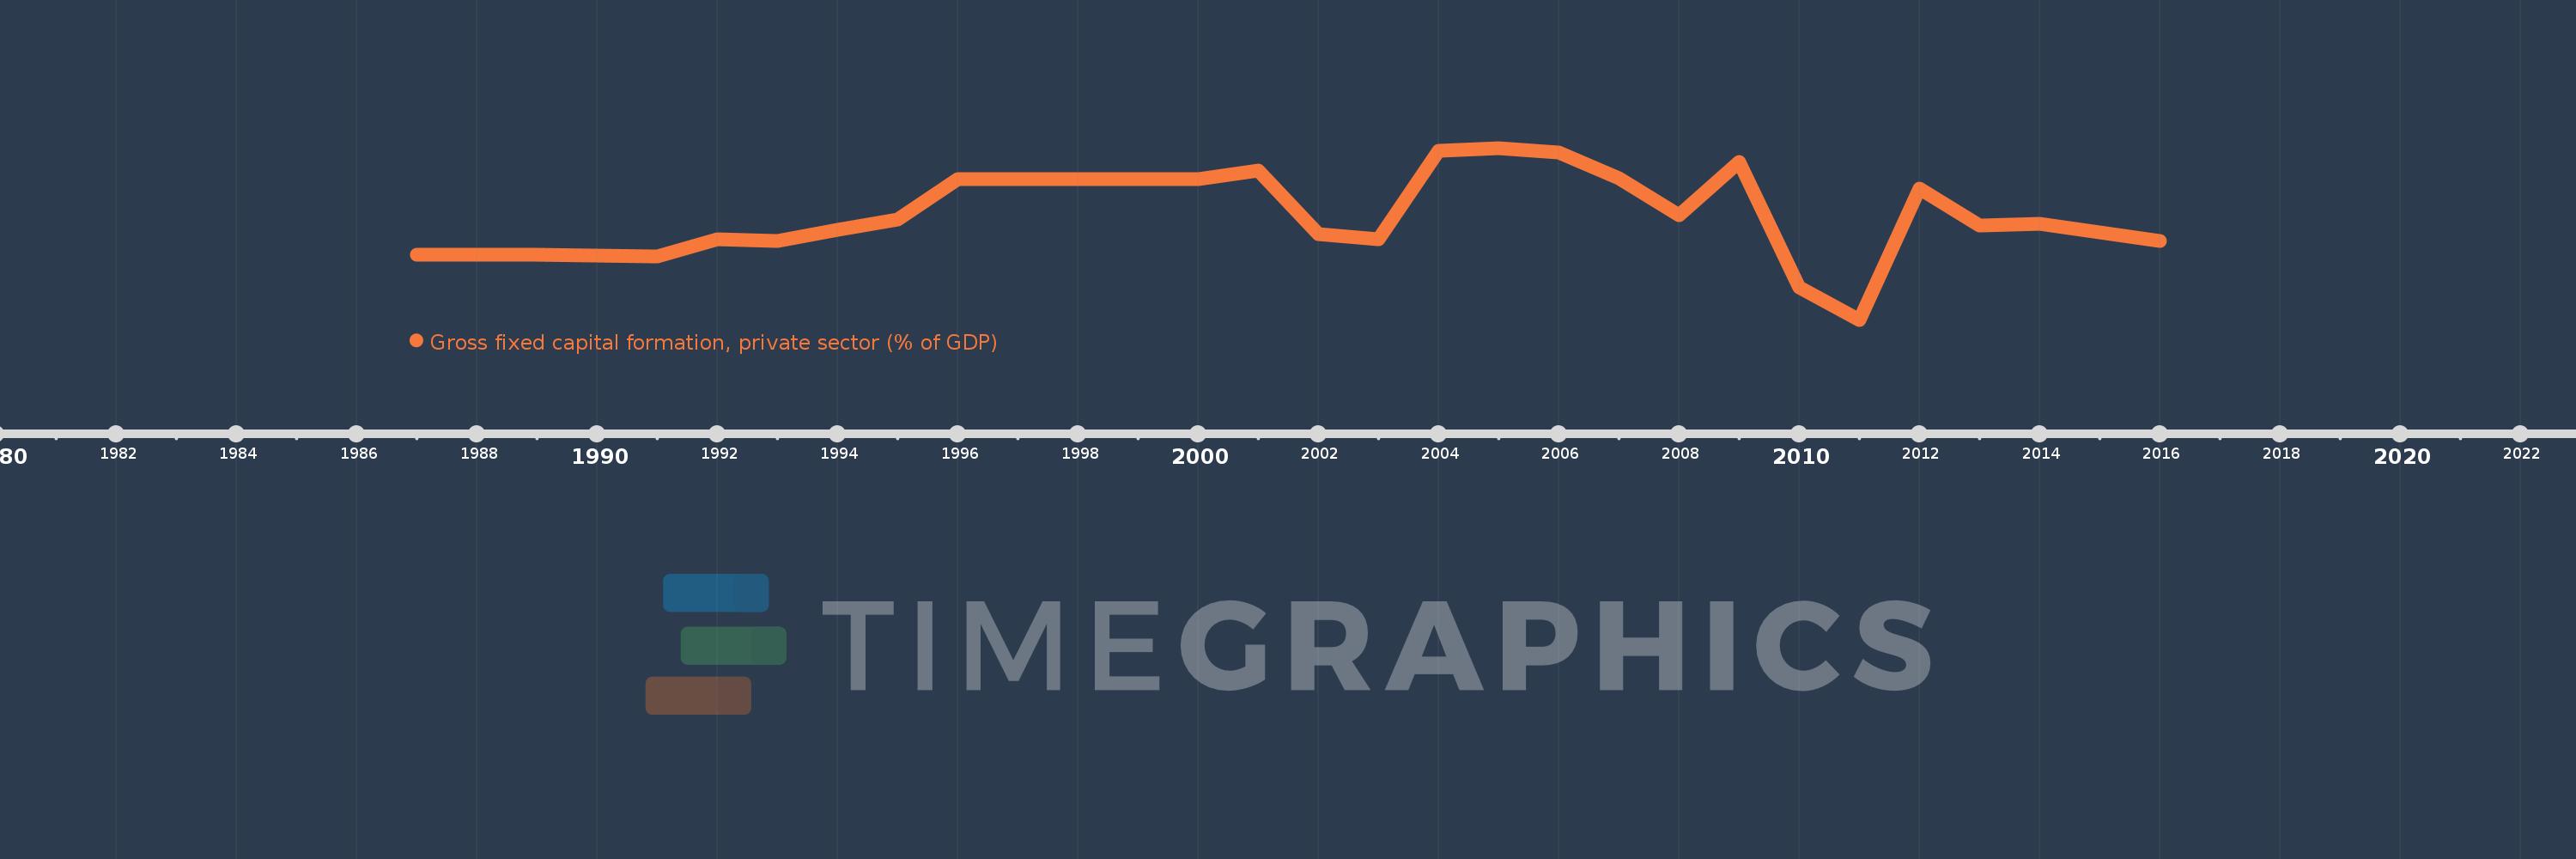
Gross fixed capital formation, private sector (% of GDP)
2016,2015,2014,2013,2012,2011,2010,2009,2008,2007,2006,2005,2004,2003,2002,2001,2000,1999,1998,1997,1996,1995,1994,1993,1992,1991,1990,1989,1988,1987
This statistics in other country:
Timeline:
This timeline shows a graph from 1987 to 2016 of Guinea. No data until 1986. Number of actual observations by date: 30.
Source name:
World Development Indicators
Source organization:
World Bank national accounts data, and OECD National Accounts data files.
Categories, topics:
Economy & Growth
Last updated:
apr 23, 2017
Indicators value changes by year
Maximum:
16.074
jan 1, 2005
At the date of observation
Value
Absolute change
Change from previous value
jan 1, 1987
8.901
+8.901
0.0%
jan 1, 1988
8.9
-0.001
-0.01%
jan 1, 1990
8.852
-0.048
-0.54%
jan 1, 1991
8.783
-0.069
-0.78%
jan 1, 1992
9.956
+1.173
13.36%
jan 1, 1993
9.802
-0.155
-1.55%
jan 1, 1994
10.577
+0.775
7.91%
jan 1, 1995
11.253
+0.676
6.39%
jan 1, 1996
14.0
+2.747
24.41%
jan 1, 1999
14.0
+0.0
0.0%
jan 1, 2001
14.547
+0.547
3.91%
jan 1, 2002
10.274
-4.273
-29.37%
jan 1, 2003
9.926
-0.348
-3.38%
jan 1, 2004
15.877
+5.951
59.95%
jan 1, 2005
16.074
+0.197
1.24%
jan 1, 2006
15.755
-0.319
-1.99%
jan 1, 2007
14.026
-1.729
-10.98%
jan 1, 2008
11.549
-2.477
-17.66%
jan 1, 2009
15.112
+3.564
30.86%
jan 1, 2010
6.724
-8.388
-55.51%
jan 1, 2011
4.533
-2.19
-32.58%
jan 1, 2012
13.338
+8.805
194.23%
jan 1, 2013
10.892
-2.446
-18.34%
jan 1, 2014
10.993
+0.1
0.92%
jan 1, 2015
10.393
-0.599
-5.45%
jan 1, 2016
9.848
-0.545
-5.25%
Ranking of countries by current statistics by years


Comments: