29
/
en
AIzaSyAYiBZKx7MnpbEhh9jyipgxe19OcubqV5w
April 1, 2024
111001
Congo, Rep.
COG
true
2
1
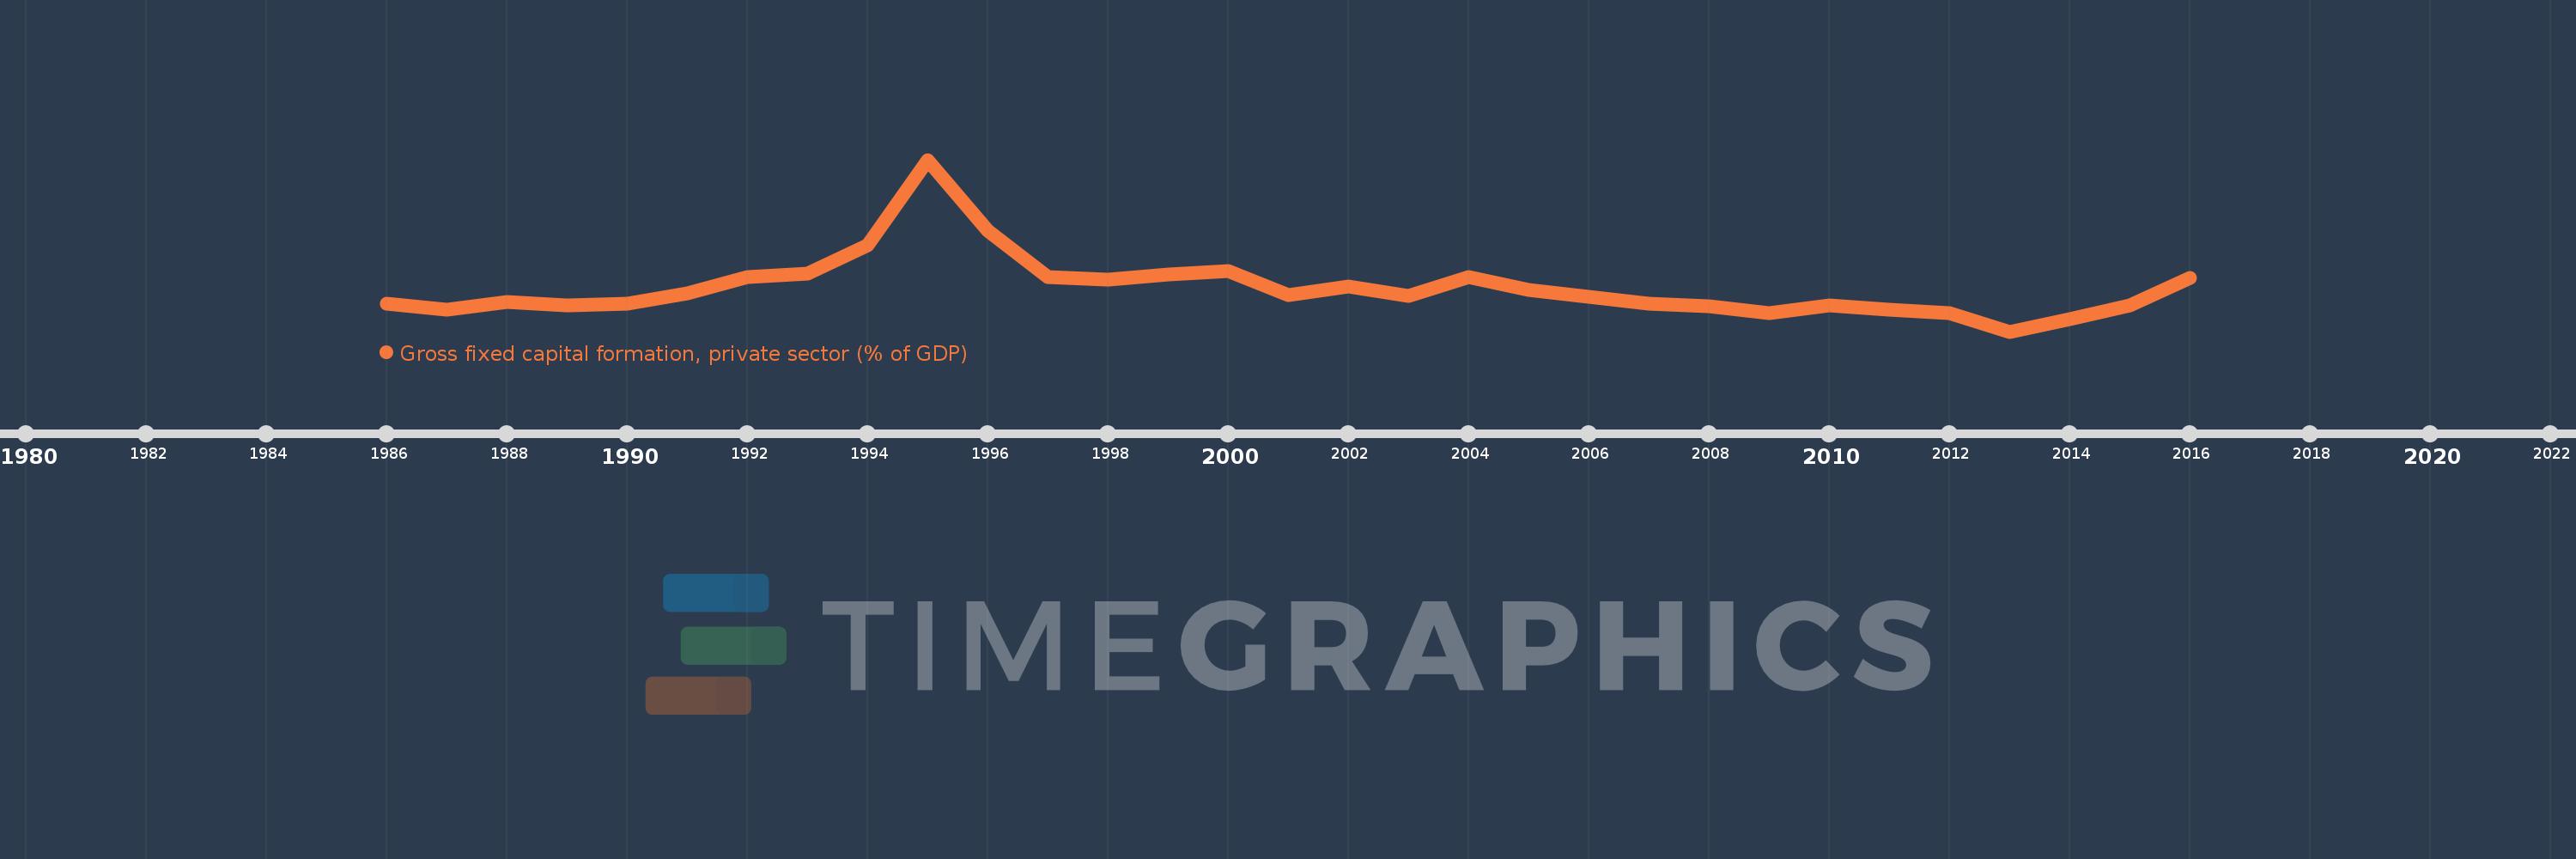
Gross fixed capital formation, private sector (% of GDP)
2016,2015,2014,2013,2012,2011,2010,2009,2008,2007,2006,2005,2004,2003,2002,2001,2000,1999,1998,1997,1996,1995,1994,1993,1992,1991,1990,1989,1988,1987,1986
This statistics in other country:
Timeline:
This timeline shows a graph from 1986 to 2016 of Congo, Rep.. No data until 1985. Number of actual observations by date: 31.
Source name:
World Development Indicators
Source organization:
World Bank national accounts data, and OECD National Accounts data files.
Categories, topics:
Economy & Growth
Last updated:
apr 23, 2017
Indicators value changes by year
Maximum:
50.165
jan 1, 1995
At the date of observation
Value
Absolute change
Change from previous value
jan 1, 1986
11.815
+11.815
0.0%
jan 1, 1987
10.119
-1.696
-14.35%
jan 1, 1988
12.256
+2.137
21.12%
jan 1, 1989
11.212
-1.044
-8.52%
jan 1, 1990
11.767
+0.555
4.95%
jan 1, 1991
14.528
+2.761
23.46%
jan 1, 1992
18.759
+4.231
29.13%
jan 1, 1993
19.822
+1.063
5.67%
jan 1, 1994
27.273
+7.45
37.59%
jan 1, 1995
50.165
+22.892
83.94%
jan 1, 1996
31.31
-18.855
-37.59%
jan 1, 1997
18.835
-12.475
-39.84%
jan 1, 1998
18.16
-0.675
-3.58%
jan 1, 1999
19.59
+1.429
7.87%
jan 1, 2000
20.437
+0.848
4.33%
jan 1, 2001
13.959
-6.479
-31.7%
jan 1, 2002
16.243
+2.284
16.36%
jan 1, 2003
13.834
-2.408
-14.83%
jan 1, 2004
18.806
+4.972
35.94%
jan 1, 2005
15.362
-3.444
-18.32%
jan 1, 2006
13.476
-1.885
-12.27%
jan 1, 2007
11.724
-1.752
-13.0%
jan 1, 2008
11.056
-0.669
-5.7%
jan 1, 2009
9.153
-1.903
-17.21%
jan 1, 2010
11.39
+2.237
24.44%
jan 1, 2011
10.209
-1.181
-10.37%
jan 1, 2012
9.129
-1.08
-10.58%
jan 1, 2013
4.297
-4.832
-52.93%
jan 1, 2014
7.57
+3.272
76.15%
jan 1, 2015
11.348
+3.778
49.91%
jan 1, 2016
18.679
+7.332
64.61%
Ranking of countries by current statistics by years


Comments: