29
/
en
AIzaSyAYiBZKx7MnpbEhh9jyipgxe19OcubqV5w
April 1, 2024
140450
Ghana
GHA
true
2
1
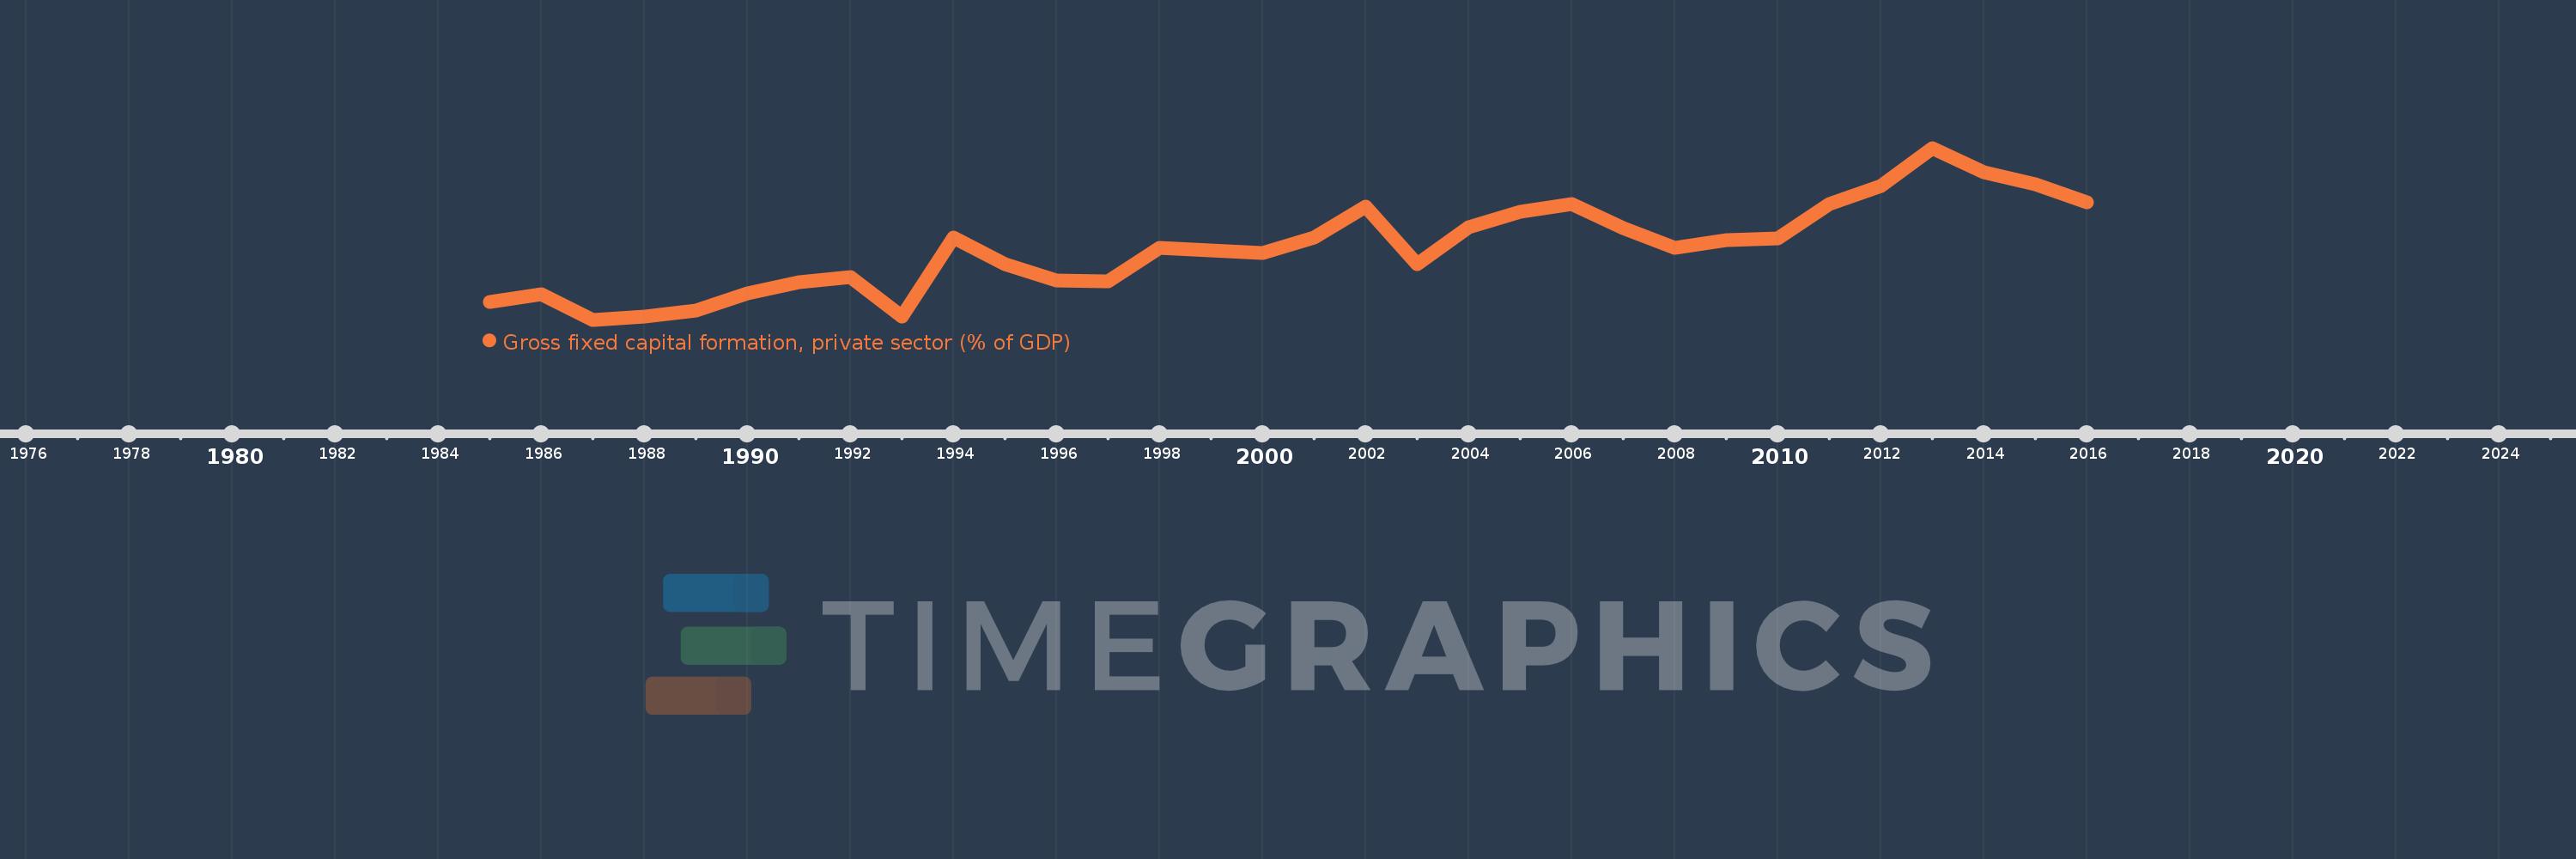
Gross fixed capital formation, private sector (% of GDP)
2016,2015,2014,2013,2012,2011,2010,2009,2008,2007,2006,2005,2004,2003,2002,2001,2000,1999,1998,1997,1996,1995,1994,1993,1992,1991,1990,1989,1988,1987,1986,1985
This statistics in other country:
Timeline:
This timeline shows a graph from 1985 to 2016 of Ghana. No data until 1984. Number of actual observations by date: 32.
Source name:
World Development Indicators
Source organization:
World Bank national accounts data, and OECD National Accounts data files.
Categories, topics:
Economy & Growth
Last updated:
apr 23, 2017
Indicators value changes by year
Maximum:
24.326
jan 1, 2013
At the date of observation
Value
Absolute change
Change from previous value
jan 1, 1985
4.371
+4.371
0.0%
jan 1, 1986
5.372
+1.0
22.88%
jan 1, 1987
2.013
-3.358
-62.52%
jan 1, 1988
2.418
+0.405
20.1%
jan 1, 1989
3.215
+0.797
32.97%
jan 1, 1990
5.401
+2.185
67.97%
jan 1, 1991
6.921
+1.521
28.16%
jan 1, 1992
7.53
+0.609
8.8%
jan 1, 1993
2.449
-5.081
-67.48%
jan 1, 1994
12.678
+10.229
417.74%
jan 1, 1995
9.277
-3.401
-26.83%
jan 1, 1996
7.082
-2.194
-23.65%
jan 1, 1997
6.99
-0.092
-1.3%
jan 1, 1998
11.393
+4.403
62.99%
jan 1, 1999
11.06
-0.333
-2.92%
jan 1, 2000
10.713
-0.347
-3.14%
jan 1, 2001
12.701
+1.988
18.56%
jan 1, 2002
16.713
+4.012
31.59%
jan 1, 2003
9.193
-7.52
-45.0%
jan 1, 2004
14.0
+4.807
52.29%
jan 1, 2005
16.0
+2.0
14.29%
jan 1, 2006
17.0
+1.0
6.25%
jan 1, 2007
13.892
-3.108
-18.28%
jan 1, 2008
11.4
-2.492
-17.94%
jan 1, 2009
12.307
+0.907
7.96%
jan 1, 2010
12.568
+0.262
2.13%
jan 1, 2011
17.088
+4.519
35.96%
jan 1, 2012
19.415
+2.328
13.62%
jan 1, 2013
24.326
+4.911
25.29%
jan 1, 2014
21.12
-3.206
-13.18%
jan 1, 2015
19.621
-1.499
-7.1%
jan 1, 2016
17.311
-2.31
-11.77%
Ranking of countries by current statistics by years


Comments: