29
/
en
AIzaSyAYiBZKx7MnpbEhh9jyipgxe19OcubqV5w
April 1, 2024
262309
Thailand
THA
true
2
1
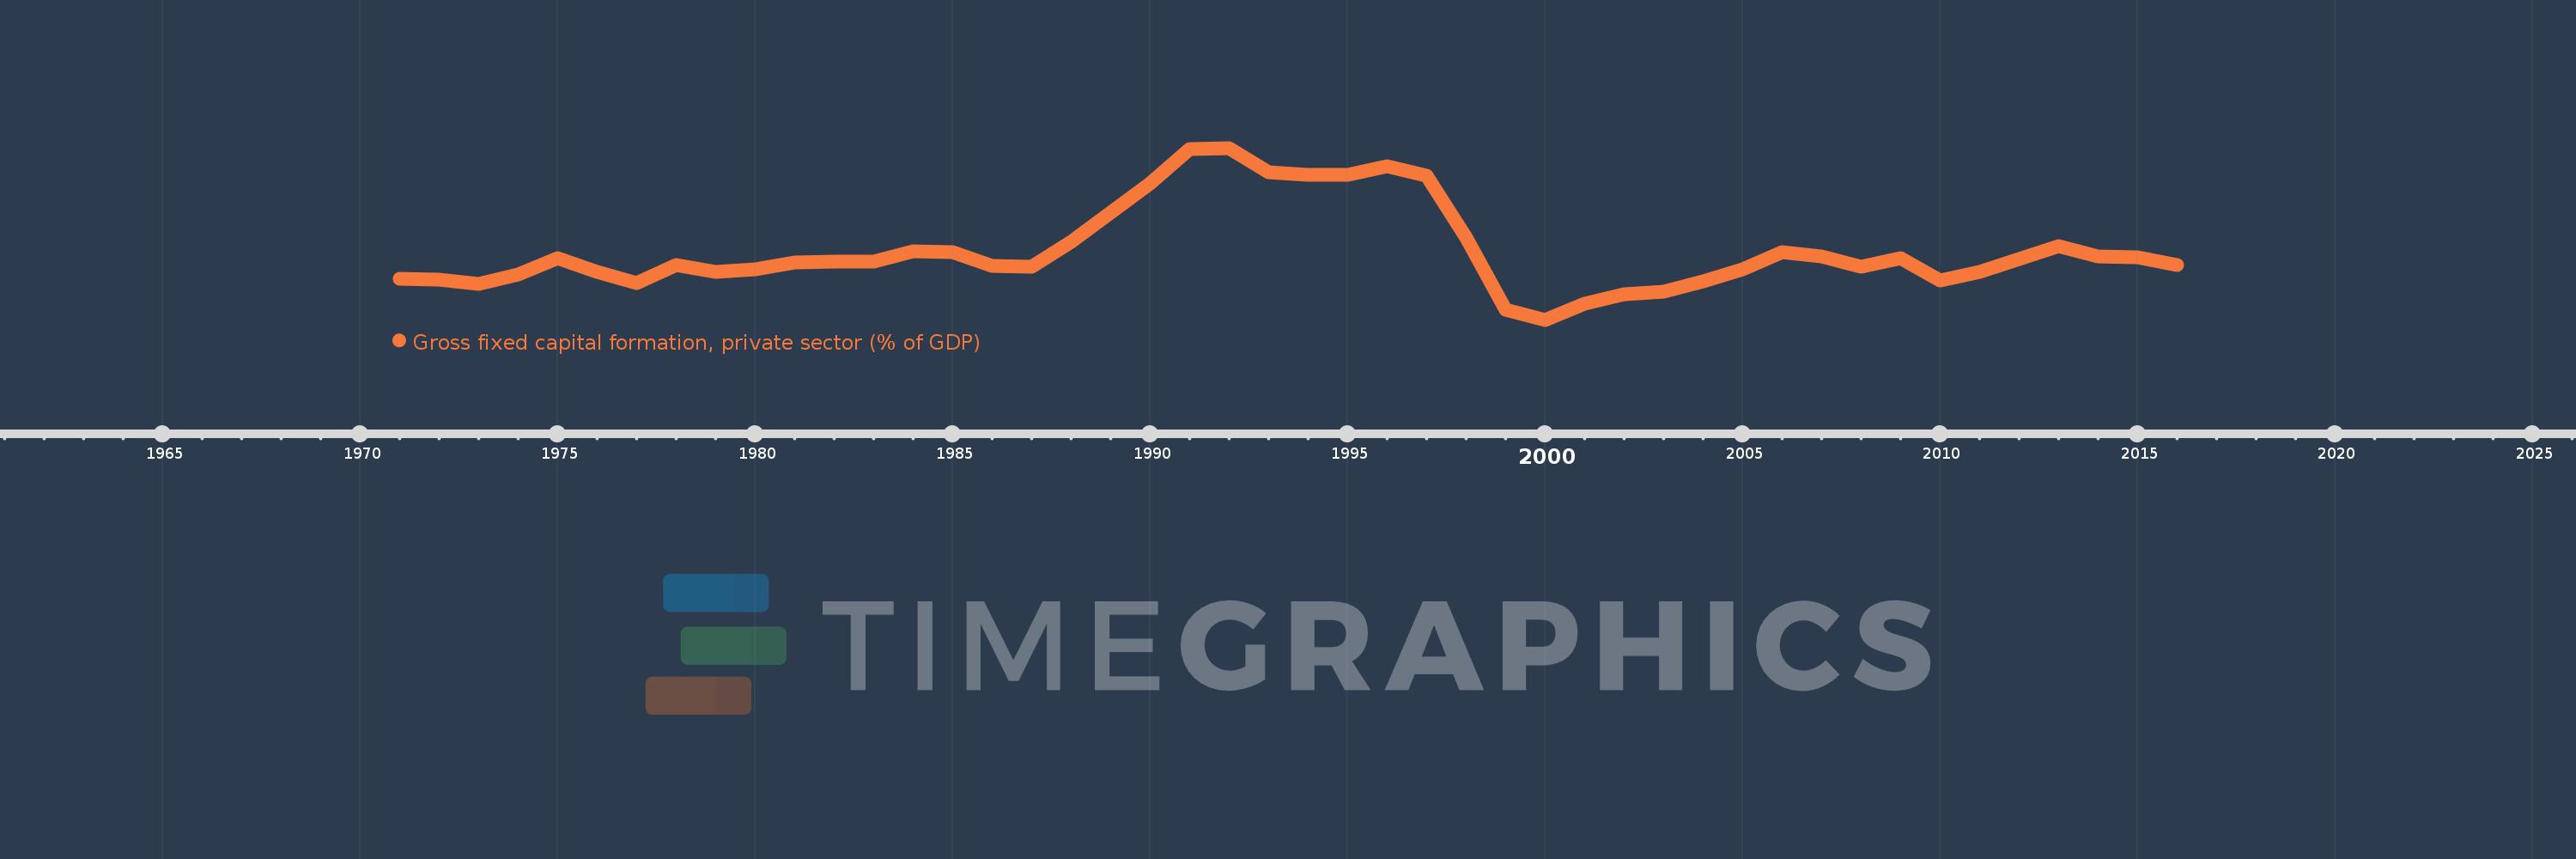
Gross fixed capital formation, private sector (% of GDP)
2016,2015,2014,2013,2012,2011,2010,2009,2008,2007,2006,2005,2004,2003,2002,2001,2000,1999,1998,1997,1996,1995,1994,1993,1992,1991,1990,1989,1988,1987,1986,1985,1984,1983,1982,1981,1980,1979,1978,1977,1976,1975,1974,1973,1972,1971
This statistics in other country:
Timeline:
This timeline shows a graph from 1971 to 2016 of Thailand. No data until 1970. Number of actual observations by date: 46.
Source name:
World Development Indicators
Source organization:
World Bank national accounts data, and OECD National Accounts data files.
Categories, topics:
Economy & Growth
Last updated:
apr 23, 2017
Indicators value changes by year
Minimum:
11.181
jan 1, 2000
Maximum:
34.413
jan 1, 1992
At the date of observation
Value
Absolute change
Change from previous value
jan 1, 1971
16.689
+16.689
0.0%
jan 1, 1972
16.623
-0.066
-0.4%
jan 1, 1973
15.991
-0.633
-3.81%
jan 1, 1974
17.335
+1.344
8.4%
jan 1, 1975
19.556
+2.221
12.81%
jan 1, 1976
17.705
-1.851
-9.46%
jan 1, 1977
16.133
-1.572
-8.88%
jan 1, 1978
18.563
+2.43
15.06%
jan 1, 1979
17.595
-0.967
-5.21%
jan 1, 1980
17.982
+0.387
2.2%
jan 1, 1981
18.925
+0.943
5.25%
jan 1, 1982
19.048
+0.123
0.65%
jan 1, 1983
19.051
+0.003
0.01%
jan 1, 1984
20.466
+1.416
7.43%
jan 1, 1985
20.294
-0.172
-0.84%
jan 1, 1986
18.465
-1.83
-9.02%
jan 1, 1987
18.406
-0.059
-0.32%
jan 1, 1988
21.677
+3.271
17.77%
jan 1, 1989
25.633
+3.955
18.25%
jan 1, 1990
29.575
+3.942
15.38%
jan 1, 1991
34.242
+4.668
15.78%
jan 1, 1992
34.413
+0.17
0.5%
jan 1, 1993
31.137
-3.276
-9.52%
jan 1, 1994
30.739
-0.398
-1.28%
jan 1, 1995
30.73
-0.009
-0.03%
jan 1, 1996
31.958
+1.229
4.0%
jan 1, 1997
30.662
-1.297
-4.06%
jan 1, 1998
22.259
-8.402
-27.4%
jan 1, 1999
12.525
-9.735
-43.73%
jan 1, 2000
11.181
-1.344
-10.73%
jan 1, 2001
13.396
+2.215
19.81%
jan 1, 2002
14.681
+1.285
9.59%
jan 1, 2003
15.004
+0.324
2.2%
jan 1, 2004
16.408
+1.404
9.36%
jan 1, 2005
18.055
+1.647
10.04%
jan 1, 2006
20.286
+2.231
12.35%
jan 1, 2007
19.743
-0.543
-2.67%
jan 1, 2008
18.357
-1.386
-7.02%
jan 1, 2009
19.514
+1.157
6.3%
jan 1, 2010
16.469
-3.046
-15.61%
jan 1, 2011
17.628
+1.16
7.04%
jan 1, 2012
19.367
+1.738
9.86%
jan 1, 2013
21.116
+1.749
9.03%
jan 1, 2014
19.698
-1.417
-6.71%
jan 1, 2015
19.58
-0.118
-0.6%
jan 1, 2016
18.546
-1.034
-5.28%
Ranking of countries by current statistics by years


Comments: