29
/
en
AIzaSyAYiBZKx7MnpbEhh9jyipgxe19OcubqV5w
April 1, 2024
272306
Uganda
UGA
true
2
1
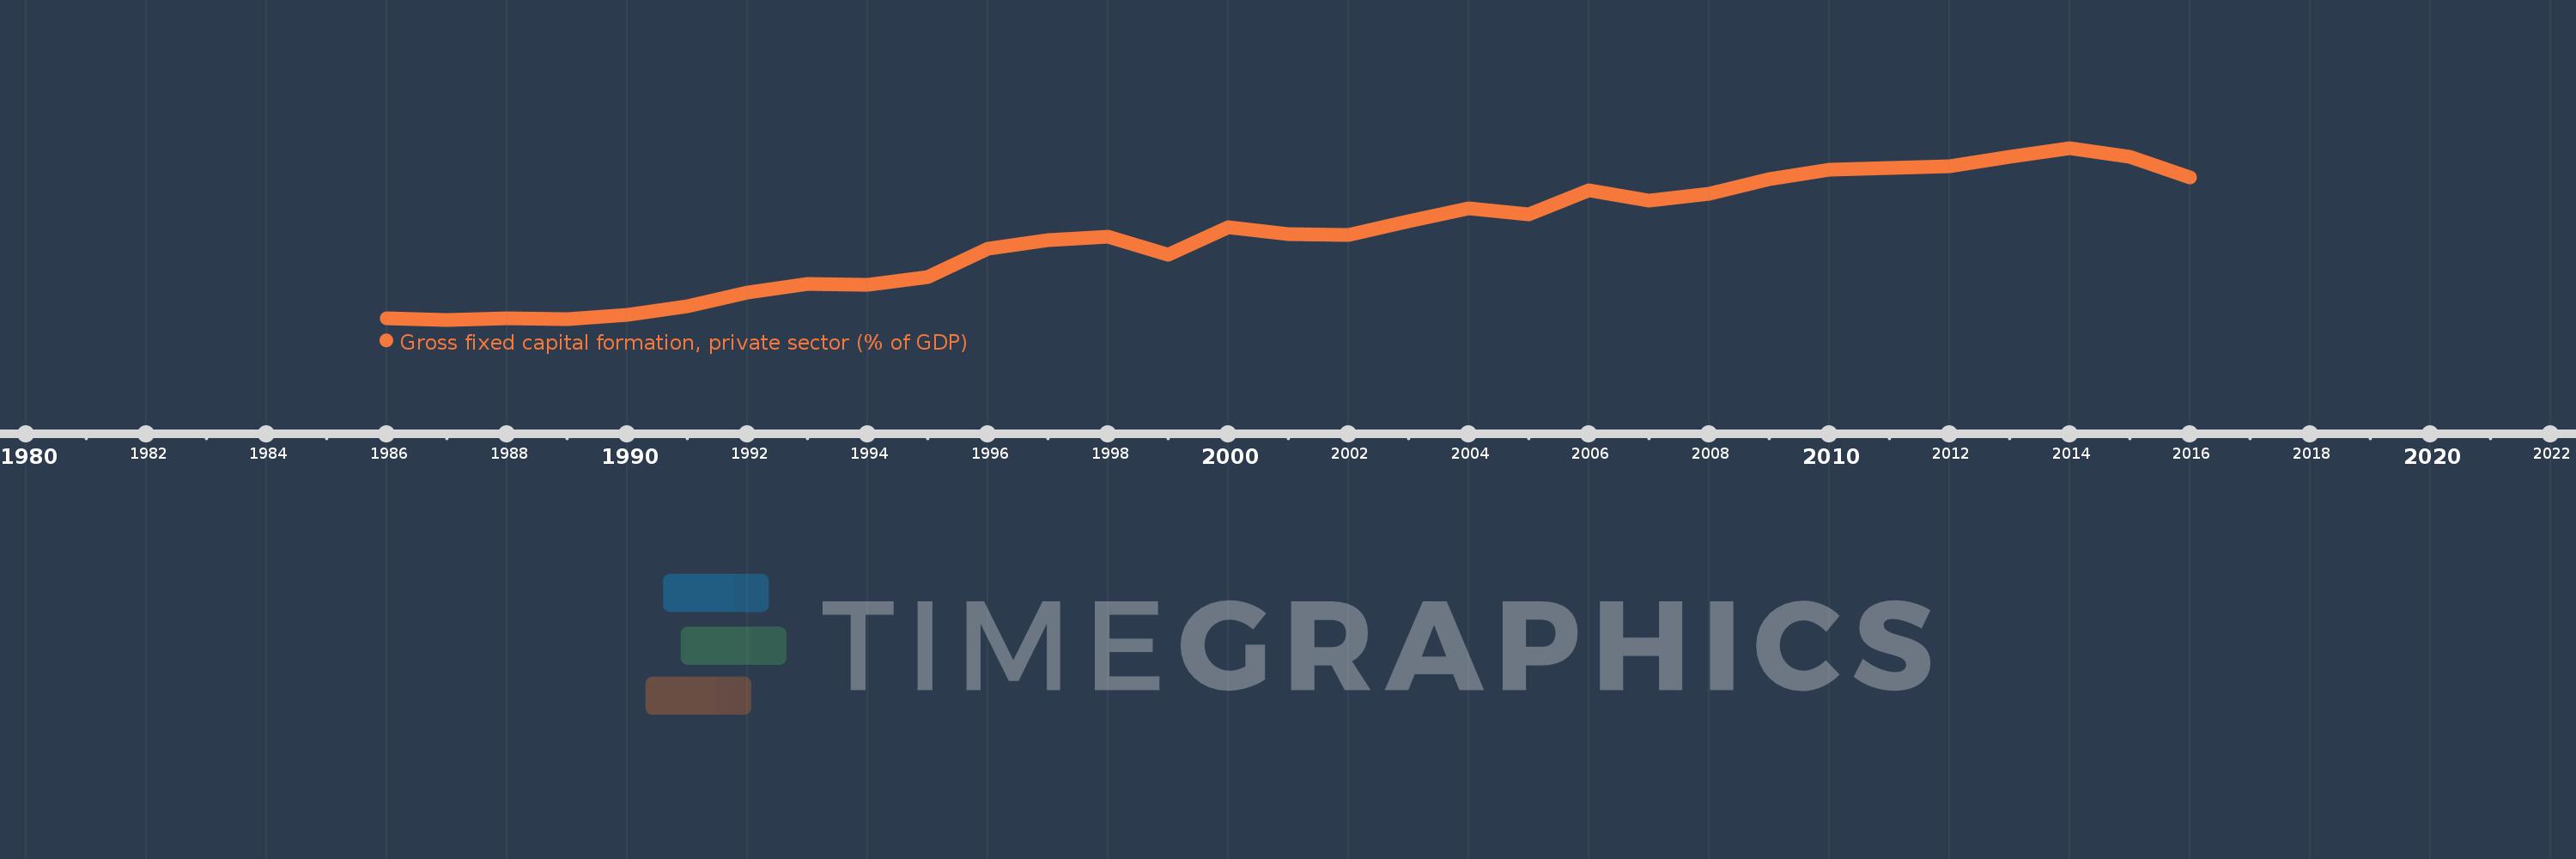
Gross fixed capital formation, private sector (% of GDP)
2016,2015,2014,2013,2012,2011,2010,2009,2008,2007,2006,2005,2004,2003,2002,2001,2000,1999,1998,1997,1996,1995,1994,1993,1992,1991,1990,1989,1988,1987,1986
This statistics in other country:
Timeline:
This timeline shows a graph from 1986 to 2016 of Uganda. No data until 1985. Number of actual observations by date: 31.
Source name:
World Development Indicators
Source organization:
World Bank national accounts data, and OECD National Accounts data files.
Categories, topics:
Economy & Growth
Last updated:
apr 23, 2017
Indicators value changes by year
Maximum:
21.186
jan 1, 2014
At the date of observation
Value
Absolute change
Change from previous value
jan 1, 1986
5.325
+5.325
0.0%
jan 1, 1987
5.22
-0.105
-1.97%
jan 1, 1988
5.373
+0.153
2.93%
jan 1, 1989
5.236
-0.138
-2.56%
jan 1, 1990
5.686
+0.451
8.61%
jan 1, 1991
6.467
+0.781
13.73%
jan 1, 1992
7.759
+1.291
19.97%
jan 1, 1993
8.517
+0.758
9.77%
jan 1, 1994
8.491
-0.025
-0.3%
jan 1, 1995
9.197
+0.706
8.31%
jan 1, 1996
11.82
+2.624
28.53%
jan 1, 1997
12.607
+0.786
6.65%
jan 1, 1998
12.908
+0.301
2.39%
jan 1, 1999
11.265
-1.643
-12.73%
jan 1, 2000
13.842
+2.577
22.88%
jan 1, 2001
13.175
-0.667
-4.82%
jan 1, 2002
13.093
-0.083
-0.63%
jan 1, 2003
14.388
+1.295
9.89%
jan 1, 2004
15.612
+1.224
8.5%
jan 1, 2005
15.028
-0.584
-3.74%
jan 1, 2006
17.231
+2.203
14.66%
jan 1, 2007
16.324
-0.907
-5.26%
jan 1, 2008
16.933
+0.609
3.73%
jan 1, 2009
18.301
+1.368
8.08%
jan 1, 2010
19.135
+0.834
4.56%
jan 1, 2011
19.353
+0.218
1.14%
jan 1, 2012
19.506
+0.154
0.79%
jan 1, 2013
20.37
+0.863
4.43%
jan 1, 2014
21.186
+0.816
4.01%
jan 1, 2015
20.339
-0.847
-4.0%
jan 1, 2016
18.409
-1.931
-9.49%
Ranking of countries by current statistics by years


Comments: