29
/
en
AIzaSyAYiBZKx7MnpbEhh9jyipgxe19OcubqV5w
April 1, 2024
89868
Botswana
BWA
true
2
1
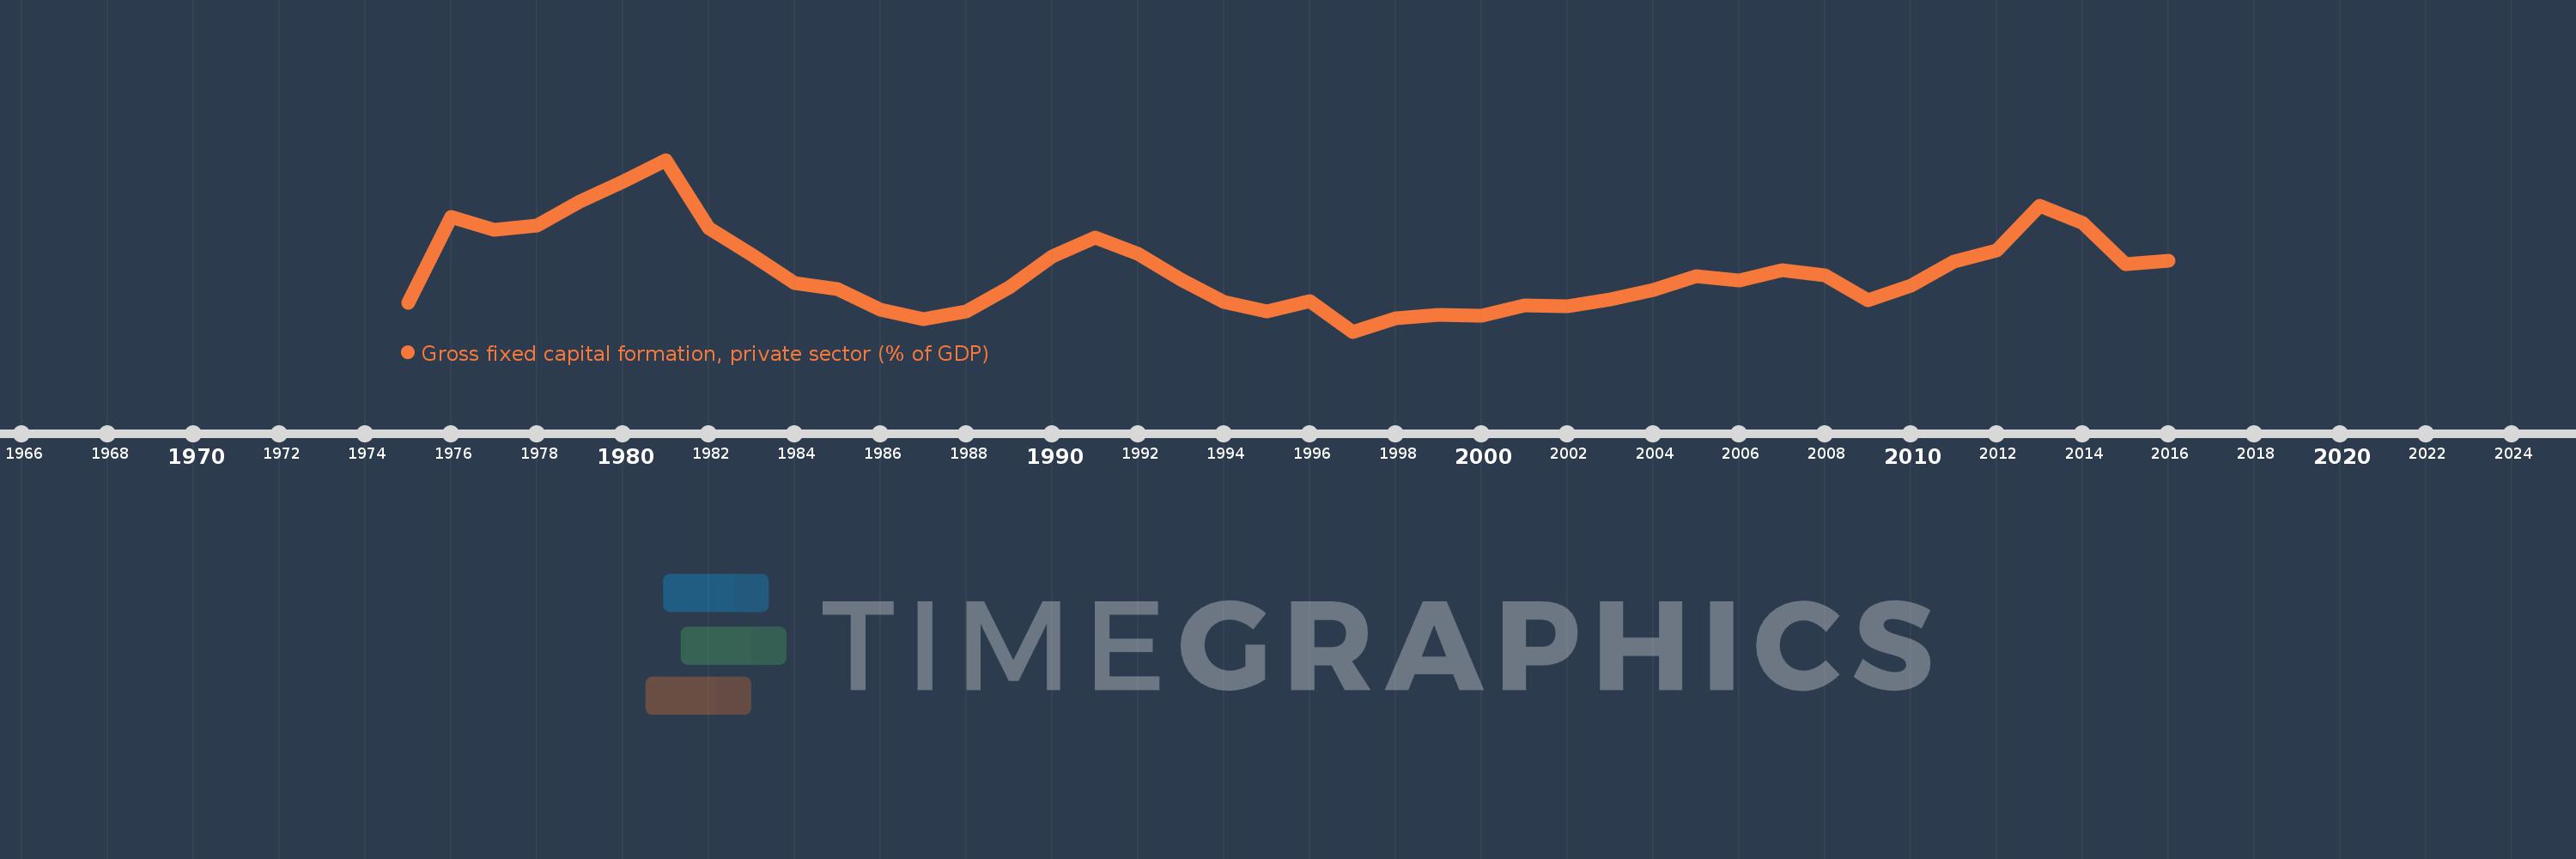
Gross fixed capital formation, private sector (% of GDP)
2016,2015,2014,2013,2012,2011,2010,2009,2008,2007,2006,2005,2004,2003,2002,2001,2000,1999,1998,1997,1996,1995,1994,1993,1992,1991,1990,1989,1988,1987,1986,1985,1984,1983,1982,1981,1980,1979,1978,1977,1976,1975
This statistics in other country:
Timeline:
This timeline shows a graph from 1975 to 2016 of Botswana. No data until 1974. Number of actual observations by date: 42.
Source name:
World Development Indicators
Source organization:
World Bank national accounts data, and OECD National Accounts data files.
Categories, topics:
Economy & Growth
Last updated:
apr 23, 2017
Indicators value changes by year
Minimum:
10.877
jan 1, 1997
Maximum:
34.516
jan 1, 1981
At the date of observation
Value
Absolute change
Change from previous value
jan 1, 1975
14.859
+14.859
0.0%
jan 1, 1976
26.613
+11.754
79.1%
jan 1, 1977
24.93
-1.683
-6.32%
jan 1, 1978
25.51
+0.579
2.32%
jan 1, 1979
28.807
+3.297
12.92%
jan 1, 1980
31.473
+2.666
9.25%
jan 1, 1981
34.516
+3.043
9.67%
jan 1, 1982
25.125
-9.391
-27.21%
jan 1, 1983
21.42
-3.705
-14.75%
jan 1, 1984
17.521
-3.899
-18.2%
jan 1, 1985
16.691
-0.831
-4.74%
jan 1, 1986
13.838
-2.853
-17.09%
jan 1, 1987
12.628
-1.211
-8.75%
jan 1, 1988
13.705
+1.078
8.53%
jan 1, 1989
16.931
+3.226
23.54%
jan 1, 1990
21.255
+4.324
25.54%
jan 1, 1991
23.773
+2.518
11.85%
jan 1, 1992
21.537
-2.236
-9.41%
jan 1, 1993
17.992
-3.545
-16.46%
jan 1, 1994
14.954
-3.038
-16.89%
jan 1, 1995
13.661
-1.293
-8.65%
jan 1, 1996
15.064
+1.403
10.27%
jan 1, 1997
10.877
-4.186
-27.79%
jan 1, 1998
12.71
+1.833
16.85%
jan 1, 1999
13.222
+0.512
4.03%
jan 1, 2000
13.073
-0.15
-1.13%
jan 1, 2001
14.528
+1.455
11.13%
jan 1, 2002
14.385
-0.142
-0.98%
jan 1, 2003
15.268
+0.883
6.14%
jan 1, 2004
16.568
+1.3
8.51%
jan 1, 2005
18.54
+1.972
11.9%
jan 1, 2006
17.885
-0.655
-3.53%
jan 1, 2007
19.341
+1.456
8.14%
jan 1, 2008
18.635
-0.706
-3.65%
jan 1, 2009
15.248
-3.387
-18.18%
jan 1, 2010
17.206
+1.958
12.84%
jan 1, 2011
20.525
+3.32
19.29%
jan 1, 2012
22.085
+1.56
7.6%
jan 1, 2013
28.172
+6.087
27.56%
jan 1, 2014
25.804
-2.369
-8.41%
jan 1, 2015
20.116
-5.688
-22.04%
jan 1, 2016
20.65
+0.535
2.66%
Ranking of countries by current statistics by years


Comments: