29
/
en
AIzaSyAYiBZKx7MnpbEhh9jyipgxe19OcubqV5w
April 1, 2024
183928
Macedonia, FYR
MKD
true
2
1
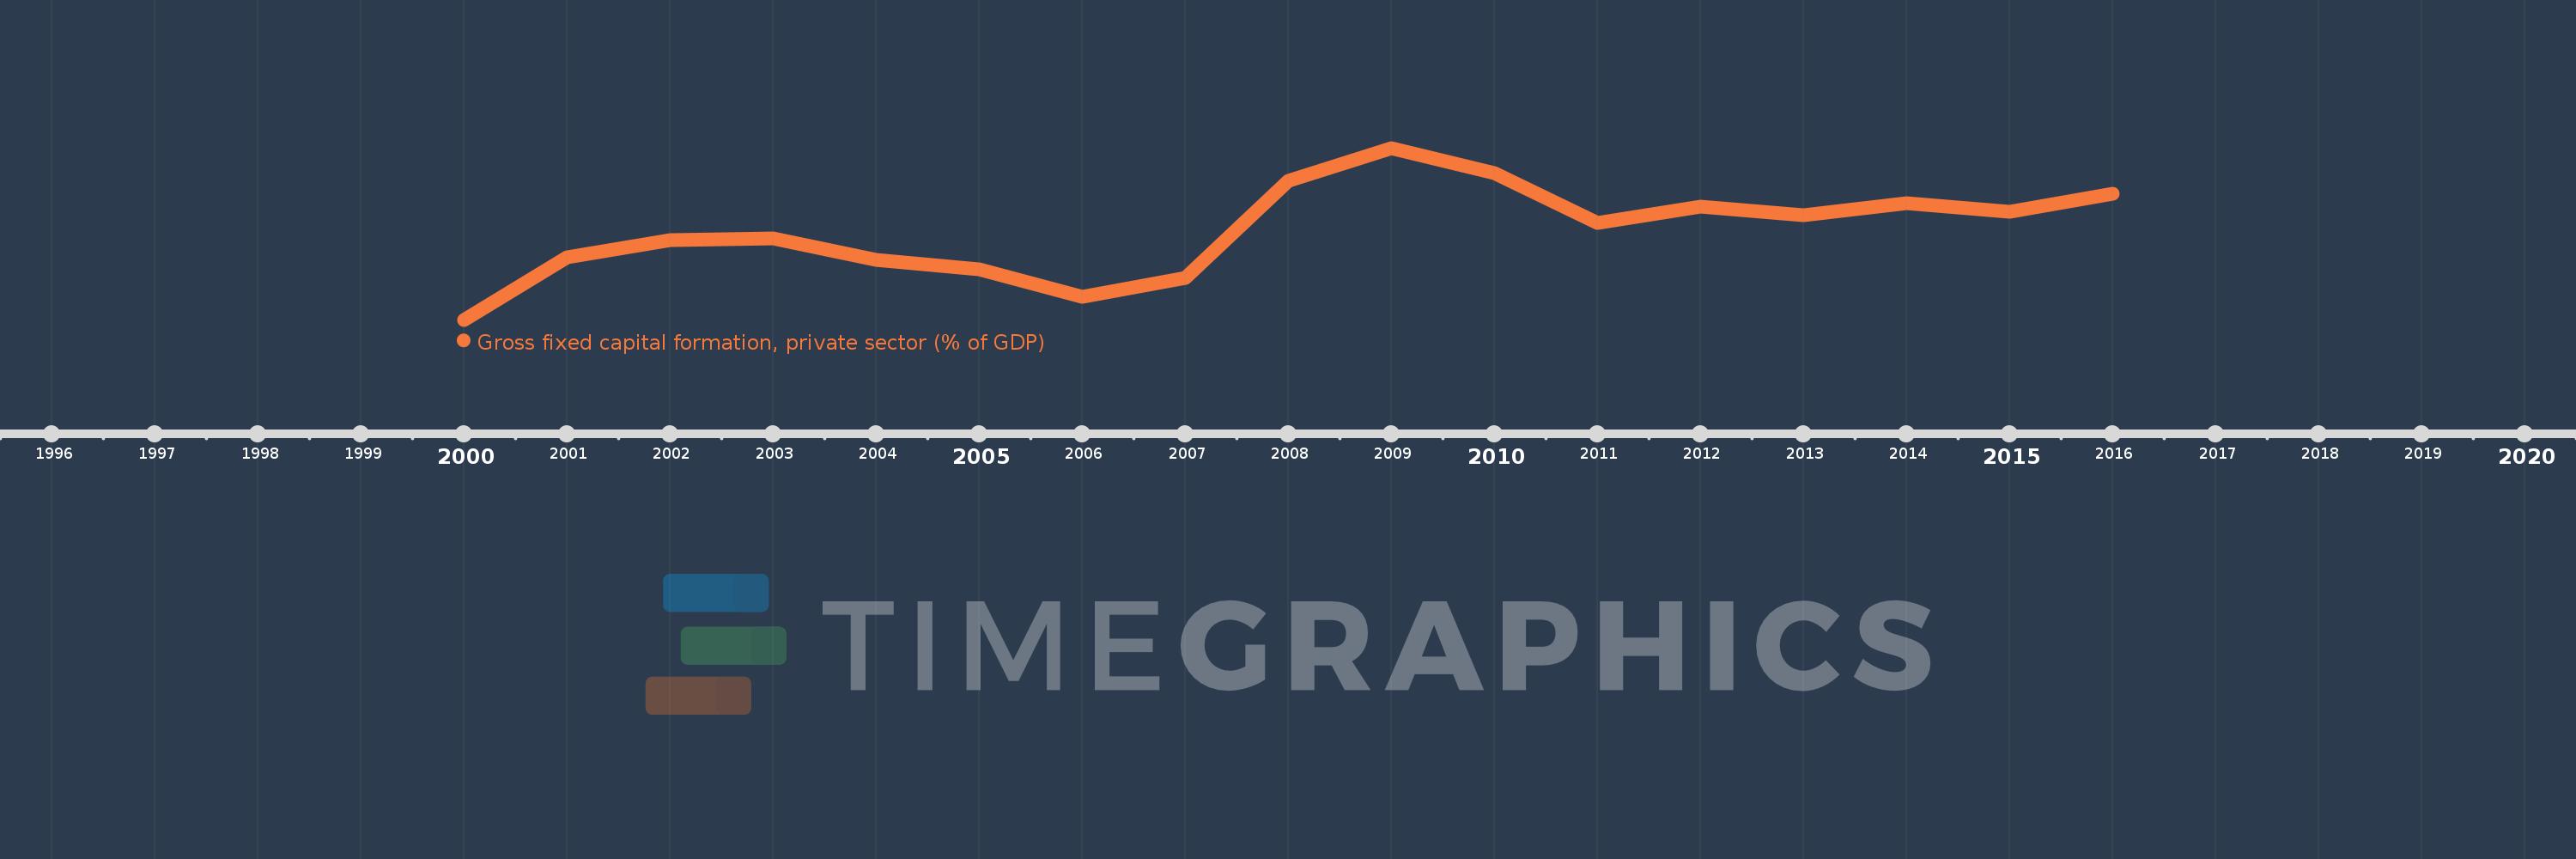
Gross fixed capital formation, private sector (% of GDP)
2016,2015,2014,2013,2012,2011,2010,2009,2008,2007,2006,2005,2004,2003,2002,2001,2000
This statistics in other country:
Timeline:
This timeline shows a graph from 2000 to 2016 of Macedonia, FYR. No data until 1999. Number of actual observations by date: 17.
Source name:
World Development Indicators
Source organization:
World Bank national accounts data, and OECD National Accounts data files.
Categories, topics:
Economy & Growth
Last updated:
apr 23, 2017
Indicators value changes by year
Minimum:
11.072
jan 1, 2000
At the date of observation
Value
Absolute change
Change from previous value
jan 1, 2000
11.072
+11.072
0.0%
jan 1, 2001
14.511
+3.439
31.06%
jan 1, 2002
15.45
+0.939
6.47%
jan 1, 2003
15.532
+0.082
0.53%
jan 1, 2004
14.37
-1.162
-7.48%
jan 1, 2005
13.831
-0.539
-3.75%
jan 1, 2006
12.323
-1.508
-10.9%
jan 1, 2007
13.361
+1.038
8.43%
jan 1, 2008
18.713
+5.352
40.05%
jan 1, 2009
20.54
+1.827
9.76%
jan 1, 2010
19.164
-1.376
-6.7%
jan 1, 2011
16.384
-2.78
-14.51%
jan 1, 2012
17.285
+0.901
5.5%
jan 1, 2013
16.856
-0.429
-2.48%
jan 1, 2014
17.486
+0.63
3.74%
jan 1, 2015
17.024
-0.461
-2.64%
jan 1, 2016
18.01
+0.986
5.79%
Ranking of countries by current statistics by years


Comments: