29
/
en
AIzaSyAYiBZKx7MnpbEhh9jyipgxe19OcubqV5w
April 1, 2024
41499
Latin America & Caribbean
LCN
false
2
1
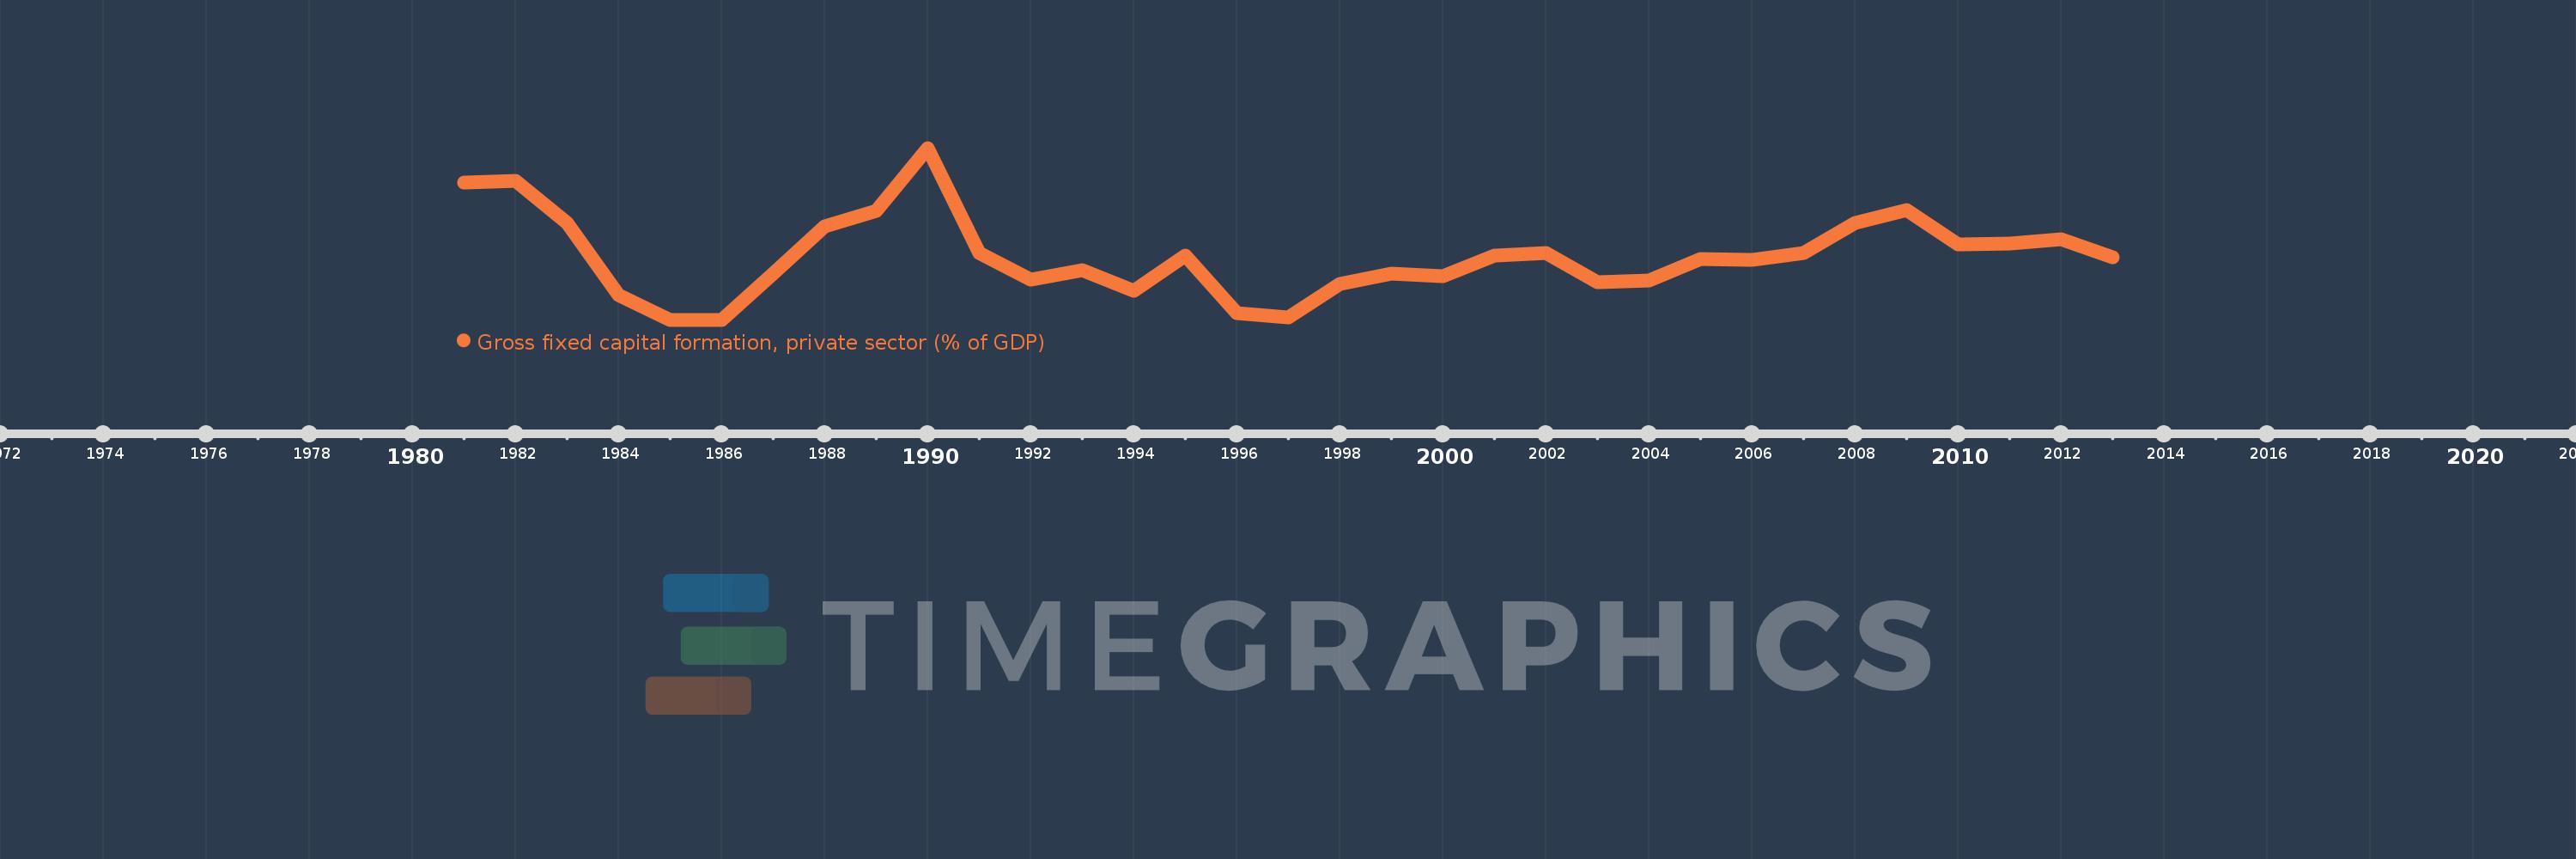
Gross fixed capital formation, private sector (% of GDP)
2013,2012,2011,2010,2009,2008,2007,2006,2005,2004,2003,2002,2001,2000,1999,1998,1997,1996,1995,1994,1993,1992,1991,1990,1989,1988,1987,1986,1985,1984,1983,1982,1981
This statistics in other country:
Timeline:
This timeline shows a graph from 1981 to 2013 of Latin America & Caribbean . No data until 1980. Number of actual observations by date: 33.
Source name:
World Development Indicators
Source organization:
World Bank national accounts data, and OECD National Accounts data files.
Categories, topics:
Economy & Growth
Last updated:
apr 23, 2017
Indicators value changes by year
Minimum:
13.015
jan 1, 1986
Maximum:
18.088
jan 1, 1990
At the date of observation
Value
Absolute change
Change from previous value
jan 1, 1981
17.061
+17.061
0.0%
jan 1, 1982
17.11
+0.049
0.29%
jan 1, 1983
15.87
-1.239
-7.24%
jan 1, 1984
13.749
-2.122
-13.37%
jan 1, 1985
13.019
-0.73
-5.31%
jan 1, 1986
13.015
-0.004
-0.03%
jan 1, 1987
14.369
+1.354
10.4%
jan 1, 1988
15.771
+1.402
9.76%
jan 1, 1989
16.224
+0.453
2.87%
jan 1, 1990
18.088
+1.864
11.49%
jan 1, 1991
14.976
-3.111
-17.2%
jan 1, 1992
14.197
-0.779
-5.2%
jan 1, 1993
14.475
+0.278
1.96%
jan 1, 1994
13.882
-0.593
-4.09%
jan 1, 1995
14.901
+1.019
7.34%
jan 1, 1996
13.205
-1.696
-11.38%
jan 1, 1997
13.074
-0.131
-1.0%
jan 1, 1998
14.083
+1.01
7.72%
jan 1, 1999
14.377
+0.294
2.09%
jan 1, 2000
14.298
-0.079
-0.55%
jan 1, 2001
14.909
+0.611
4.27%
jan 1, 2002
14.985
+0.077
0.52%
jan 1, 2003
14.127
-0.858
-5.73%
jan 1, 2004
14.164
+0.037
0.26%
jan 1, 2005
14.816
+0.652
4.6%
jan 1, 2006
14.791
-0.025
-0.17%
jan 1, 2007
14.996
+0.205
1.39%
jan 1, 2008
15.861
+0.865
5.77%
jan 1, 2009
16.244
+0.383
2.41%
jan 1, 2010
15.251
-0.993
-6.11%
jan 1, 2011
15.274
+0.023
0.15%
jan 1, 2012
15.386
+0.112
0.73%
jan 1, 2013
14.86
-0.526
-3.42%
Ranking of countries by current statistics by years


Comments: