29
/
en
AIzaSyAYiBZKx7MnpbEhh9jyipgxe19OcubqV5w
April 1, 2024
266904
Trinidad and Tobago
TTO
true
2
1
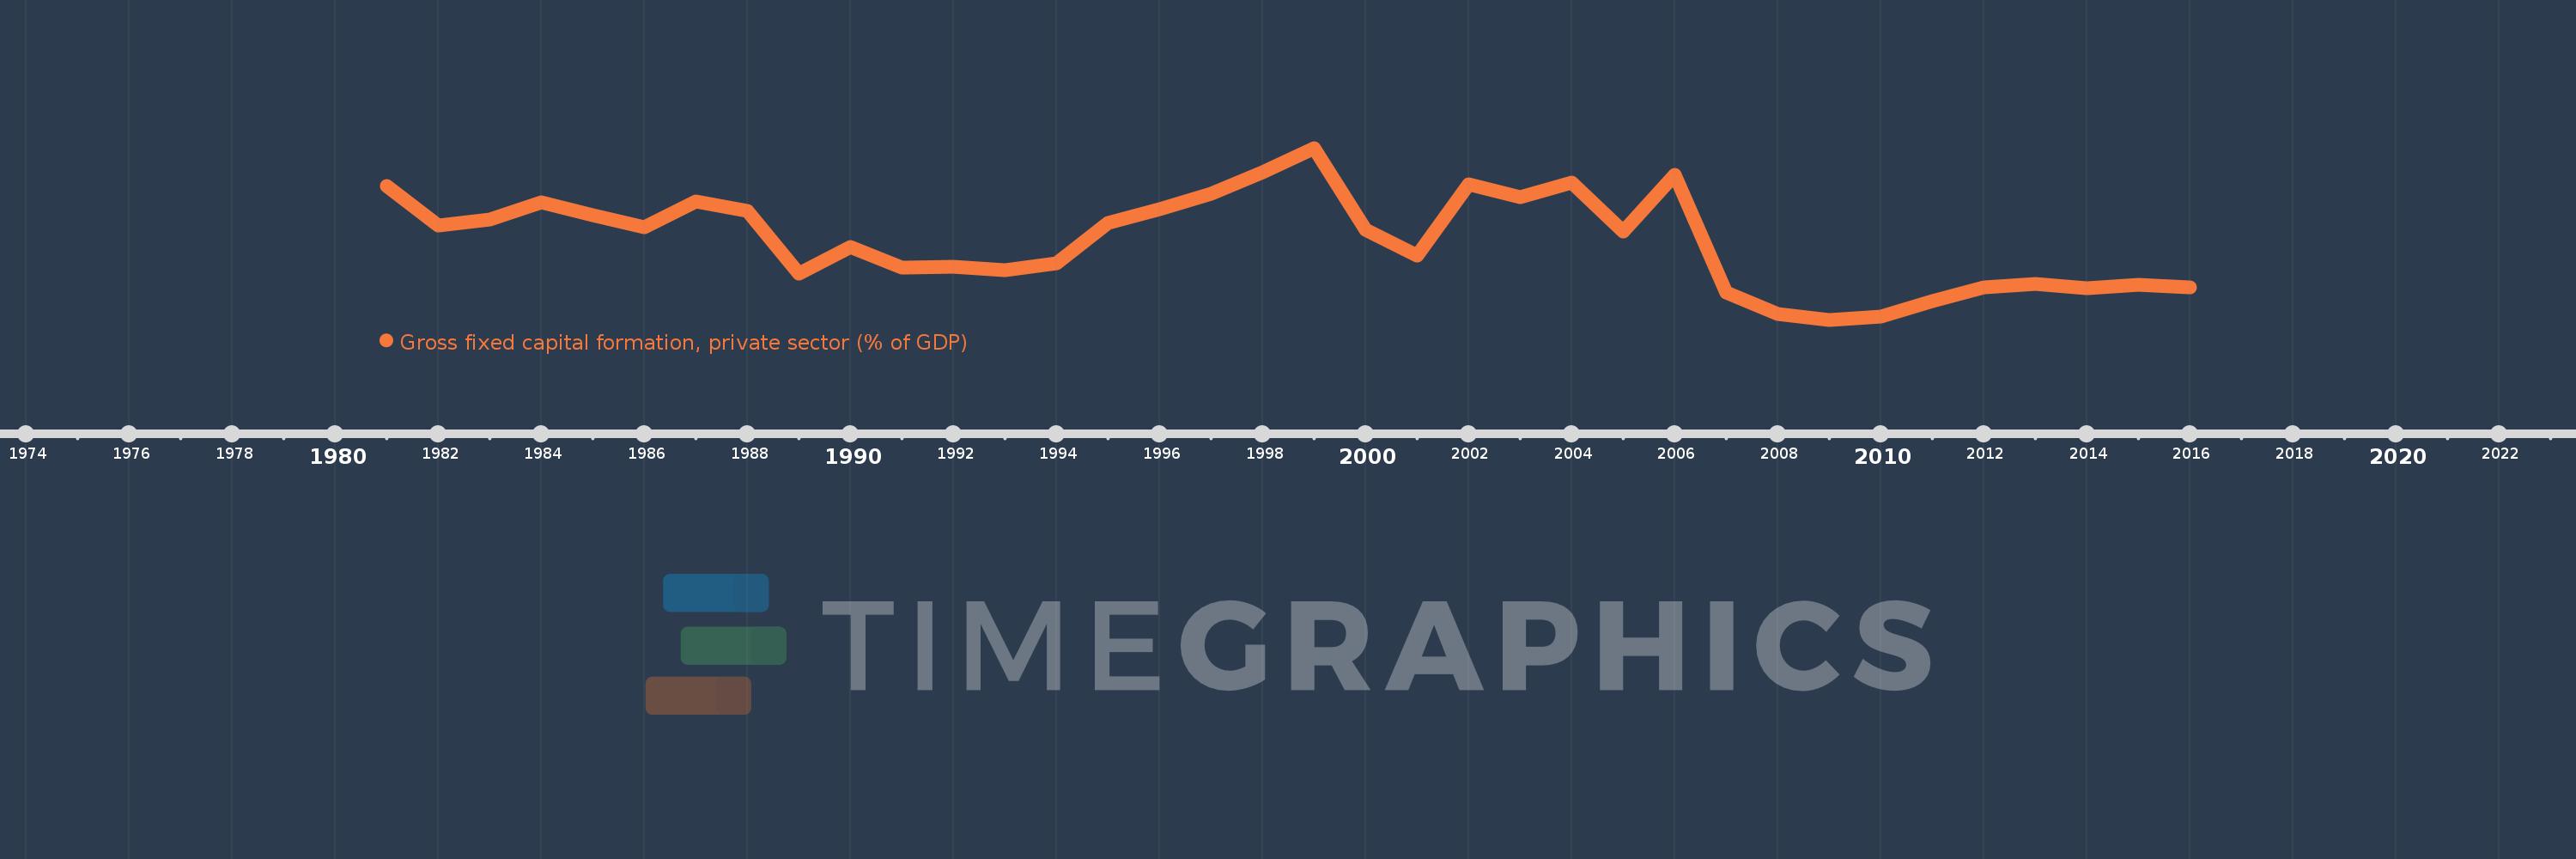
Gross fixed capital formation, private sector (% of GDP)
2016,2015,2014,2013,2012,2011,2010,2009,2008,2007,2006,2005,2004,2003,2002,2001,2000,1999,1998,1997,1996,1995,1994,1993,1992,1991,1990,1989,1988,1987,1986,1985,1984,1983,1982,1981
This statistics in other country:
Timeline:
This timeline shows a graph from 1981 to 2016 of Trinidad and Tobago. No data until 1980. Number of actual observations by date: 36.
Source name:
World Development Indicators
Source organization:
World Bank national accounts data, and OECD National Accounts data files.
Categories, topics:
Economy & Growth
Last updated:
apr 23, 2017
Indicators value changes by year
Maximum:
26.075
jan 1, 1999
At the date of observation
Value
Absolute change
Change from previous value
jan 1, 1981
20.413
+20.413
0.0%
jan 1, 1982
14.493
-5.92
-29.0%
jan 1, 1983
15.448
+0.955
6.59%
jan 1, 1984
17.925
+2.478
16.04%
jan 1, 1985
16.023
-1.902
-10.61%
jan 1, 1986
14.233
-1.79
-11.17%
jan 1, 1987
18.082
+3.85
27.05%
jan 1, 1988
16.738
-1.344
-7.43%
jan 1, 1989
7.446
-9.292
-55.52%
jan 1, 1990
11.316
+3.87
51.97%
jan 1, 1991
8.232
-3.084
-27.25%
jan 1, 1992
8.409
+0.177
2.15%
jan 1, 1993
7.894
-0.515
-6.13%
jan 1, 1994
8.926
+1.032
13.07%
jan 1, 1995
14.944
+6.018
67.43%
jan 1, 1996
17.018
+2.074
13.88%
jan 1, 1997
19.301
+2.283
13.41%
jan 1, 1998
22.459
+3.157
16.36%
jan 1, 1999
26.075
+3.617
16.1%
jan 1, 2000
13.87
-12.205
-46.81%
jan 1, 2001
10.005
-3.865
-27.87%
jan 1, 2002
20.633
+10.628
106.23%
jan 1, 2003
18.743
-1.891
-9.16%
jan 1, 2004
20.926
+2.183
11.65%
jan 1, 2005
13.587
-7.339
-35.07%
jan 1, 2006
22.03
+8.443
62.14%
jan 1, 2007
4.53
-17.501
-79.44%
jan 1, 2008
1.323
-3.207
-70.8%
jan 1, 2009
0.522
-0.801
-60.54%
jan 1, 2010
0.935
+0.413
79.05%
jan 1, 2011
3.234
+2.299
246.05%
jan 1, 2012
5.4
+2.166
66.99%
jan 1, 2013
5.896
+0.496
9.18%
jan 1, 2014
5.185
-0.711
-12.05%
jan 1, 2015
5.762
+0.576
11.11%
jan 1, 2016
5.388
-0.374
-6.49%
Ranking of countries by current statistics by years


Comments: