29
/
en
AIzaSyAYiBZKx7MnpbEhh9jyipgxe19OcubqV5w
April 1, 2024
113650
Cote d'Ivoire
CIV
true
2
1
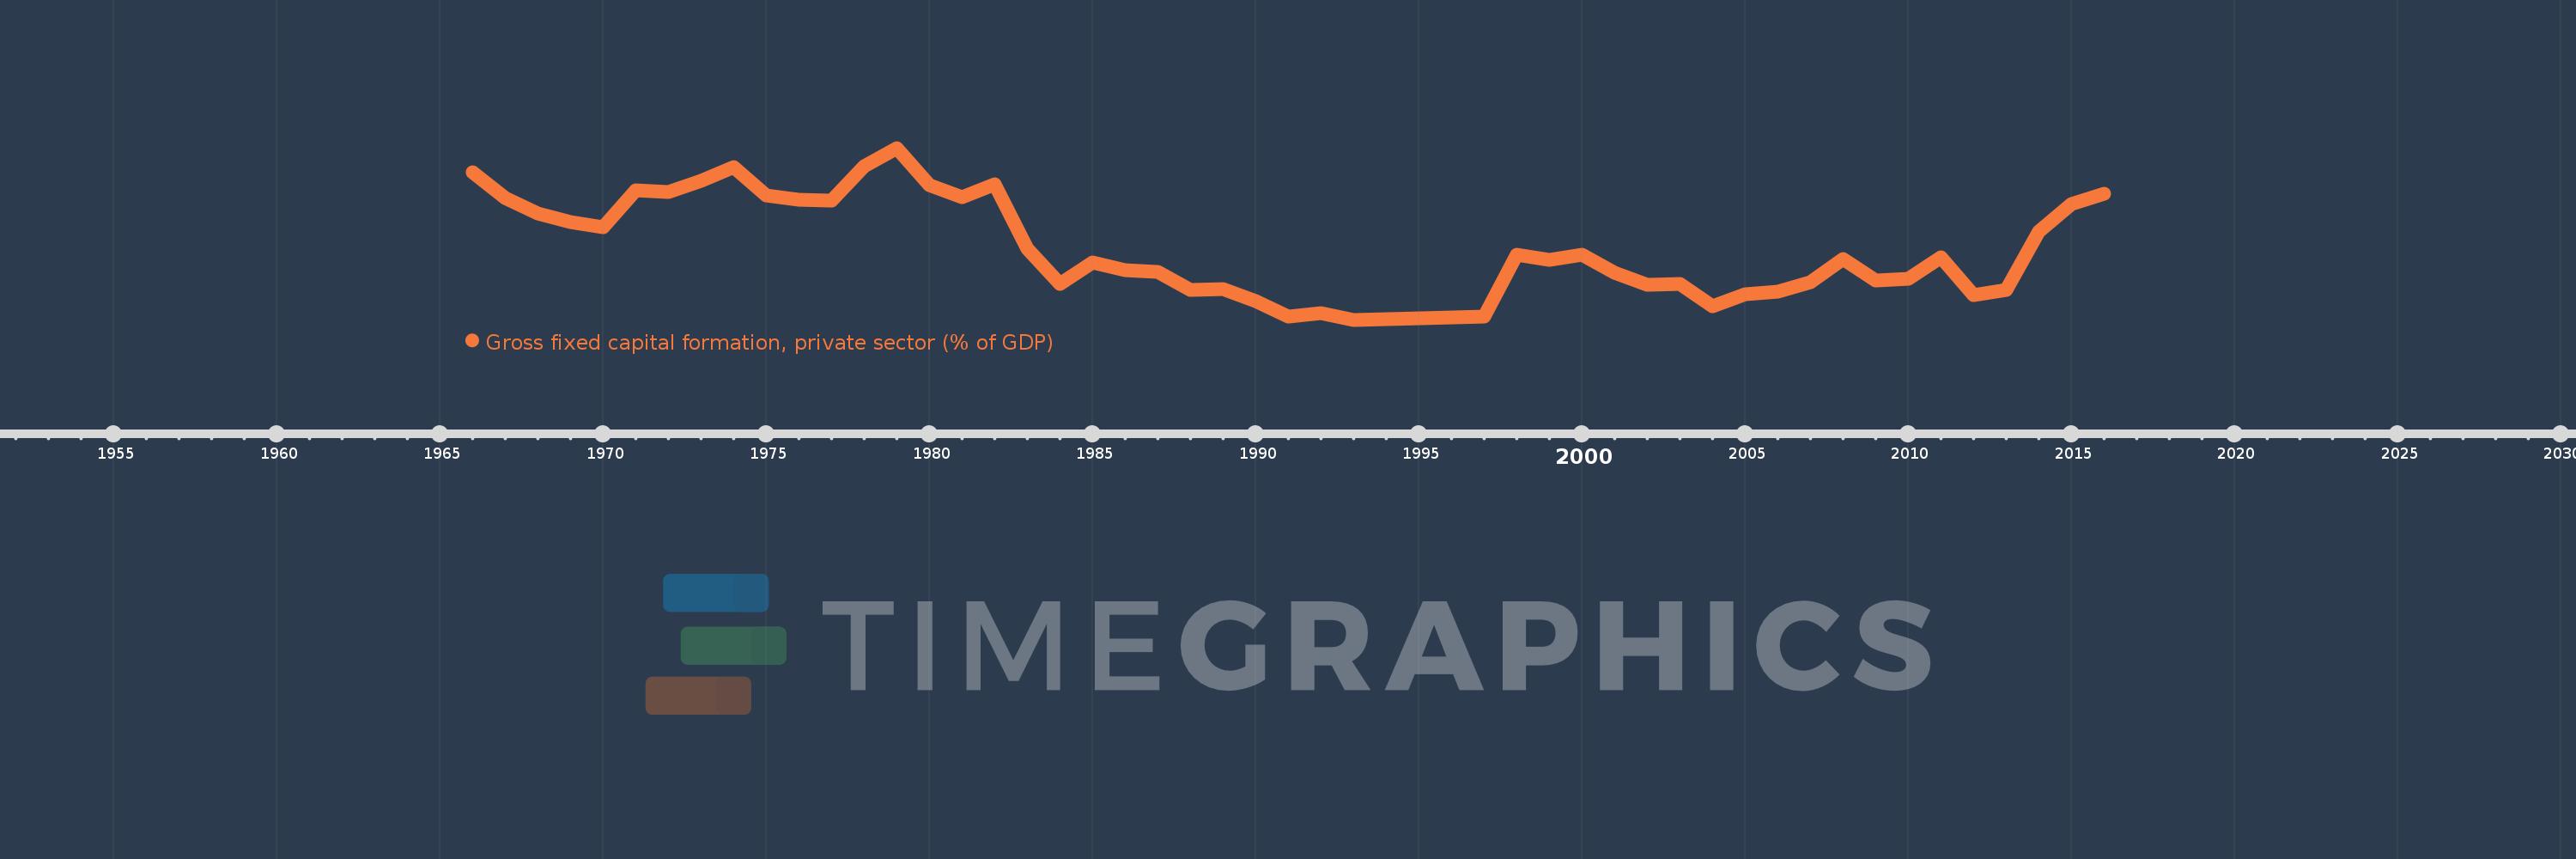
Gross fixed capital formation, private sector (% of GDP)
2016,2015,2014,2013,2012,2011,2010,2009,2008,2007,2006,2005,2004,2003,2002,2001,2000,1999,1998,1997,1993,1992,1991,1990,1989,1988,1987,1986,1985,1984,1983,1982,1981,1980,1979,1978,1977,1976,1975,1974,1973,1972,1971,1970,1969,1968,1967,1966
This statistics in other country:
Timeline:
This timeline shows a graph from 1966 to 2016 of Cote d'Ivoire. No data until 1965. Number of actual observations by date: 48.
Source name:
World Development Indicators
Source organization:
World Bank national accounts data, and OECD National Accounts data files.
Categories, topics:
Economy & Growth
Last updated:
apr 23, 2017
Indicators value changes by year
Maximum:
16.311
jan 1, 1979
At the date of observation
Value
Absolute change
Change from previous value
jan 1, 1966
14.685
+14.685
0.0%
jan 1, 1967
12.917
-1.768
-12.04%
jan 1, 1968
11.862
-1.055
-8.17%
jan 1, 1969
11.286
-0.576
-4.85%
jan 1, 1970
10.935
-0.351
-3.11%
jan 1, 1971
13.423
+2.488
22.75%
jan 1, 1972
13.342
-0.08
-0.6%
jan 1, 1973
14.096
+0.753
5.65%
jan 1, 1974
15.042
+0.946
6.71%
jan 1, 1975
13.099
-1.943
-12.92%
jan 1, 1976
12.822
-0.277
-2.11%
jan 1, 1977
12.738
-0.084
-0.66%
jan 1, 1978
15.06
+2.322
18.23%
jan 1, 1979
16.311
+1.252
8.31%
jan 1, 1980
13.8
-2.511
-15.4%
jan 1, 1981
12.96
-0.841
-6.09%
jan 1, 1982
13.861
+0.902
6.96%
jan 1, 1983
9.484
-4.377
-31.58%
jan 1, 1984
7.083
-2.401
-25.32%
jan 1, 1985
8.583
+1.5
21.18%
jan 1, 1986
8.026
-0.557
-6.49%
jan 1, 1987
7.93
-0.096
-1.2%
jan 1, 1988
6.693
-1.237
-15.6%
jan 1, 1989
6.77
+0.078
1.16%
jan 1, 1990
5.943
-0.827
-12.21%
jan 1, 1991
4.918
-1.025
-17.25%
jan 1, 1992
5.128
+0.21
4.28%
jan 1, 1993
4.681
-0.447
-8.71%
jan 1, 1997
4.895
+0.214
4.57%
jan 1, 1998
9.071
+4.175
85.29%
jan 1, 1999
8.752
-0.318
-3.51%
jan 1, 2000
9.07
+0.317
3.62%
jan 1, 2001
7.853
-1.217
-13.42%
jan 1, 2002
7.076
-0.777
-9.9%
jan 1, 2003
7.119
+0.043
0.61%
jan 1, 2004
5.616
-1.503
-21.11%
jan 1, 2005
6.392
+0.776
13.82%
jan 1, 2006
6.556
+0.164
2.56%
jan 1, 2007
7.22
+0.664
10.14%
jan 1, 2008
8.788
+1.568
21.72%
jan 1, 2009
7.358
-1.431
-16.28%
jan 1, 2010
7.441
+0.084
1.14%
jan 1, 2011
8.906
+1.465
19.69%
jan 1, 2012
6.333
-2.574
-28.9%
jan 1, 2013
6.674
+0.341
5.39%
jan 1, 2014
10.649
+3.975
59.56%
jan 1, 2015
12.51
+1.861
17.47%
jan 1, 2016
13.201
+0.692
5.53%
Ranking of countries by current statistics by years


Comments: