29
/
en
AIzaSyAYiBZKx7MnpbEhh9jyipgxe19OcubqV5w
April 1, 2024
172908
Kyrgyz Republic
KGZ
true
2
1
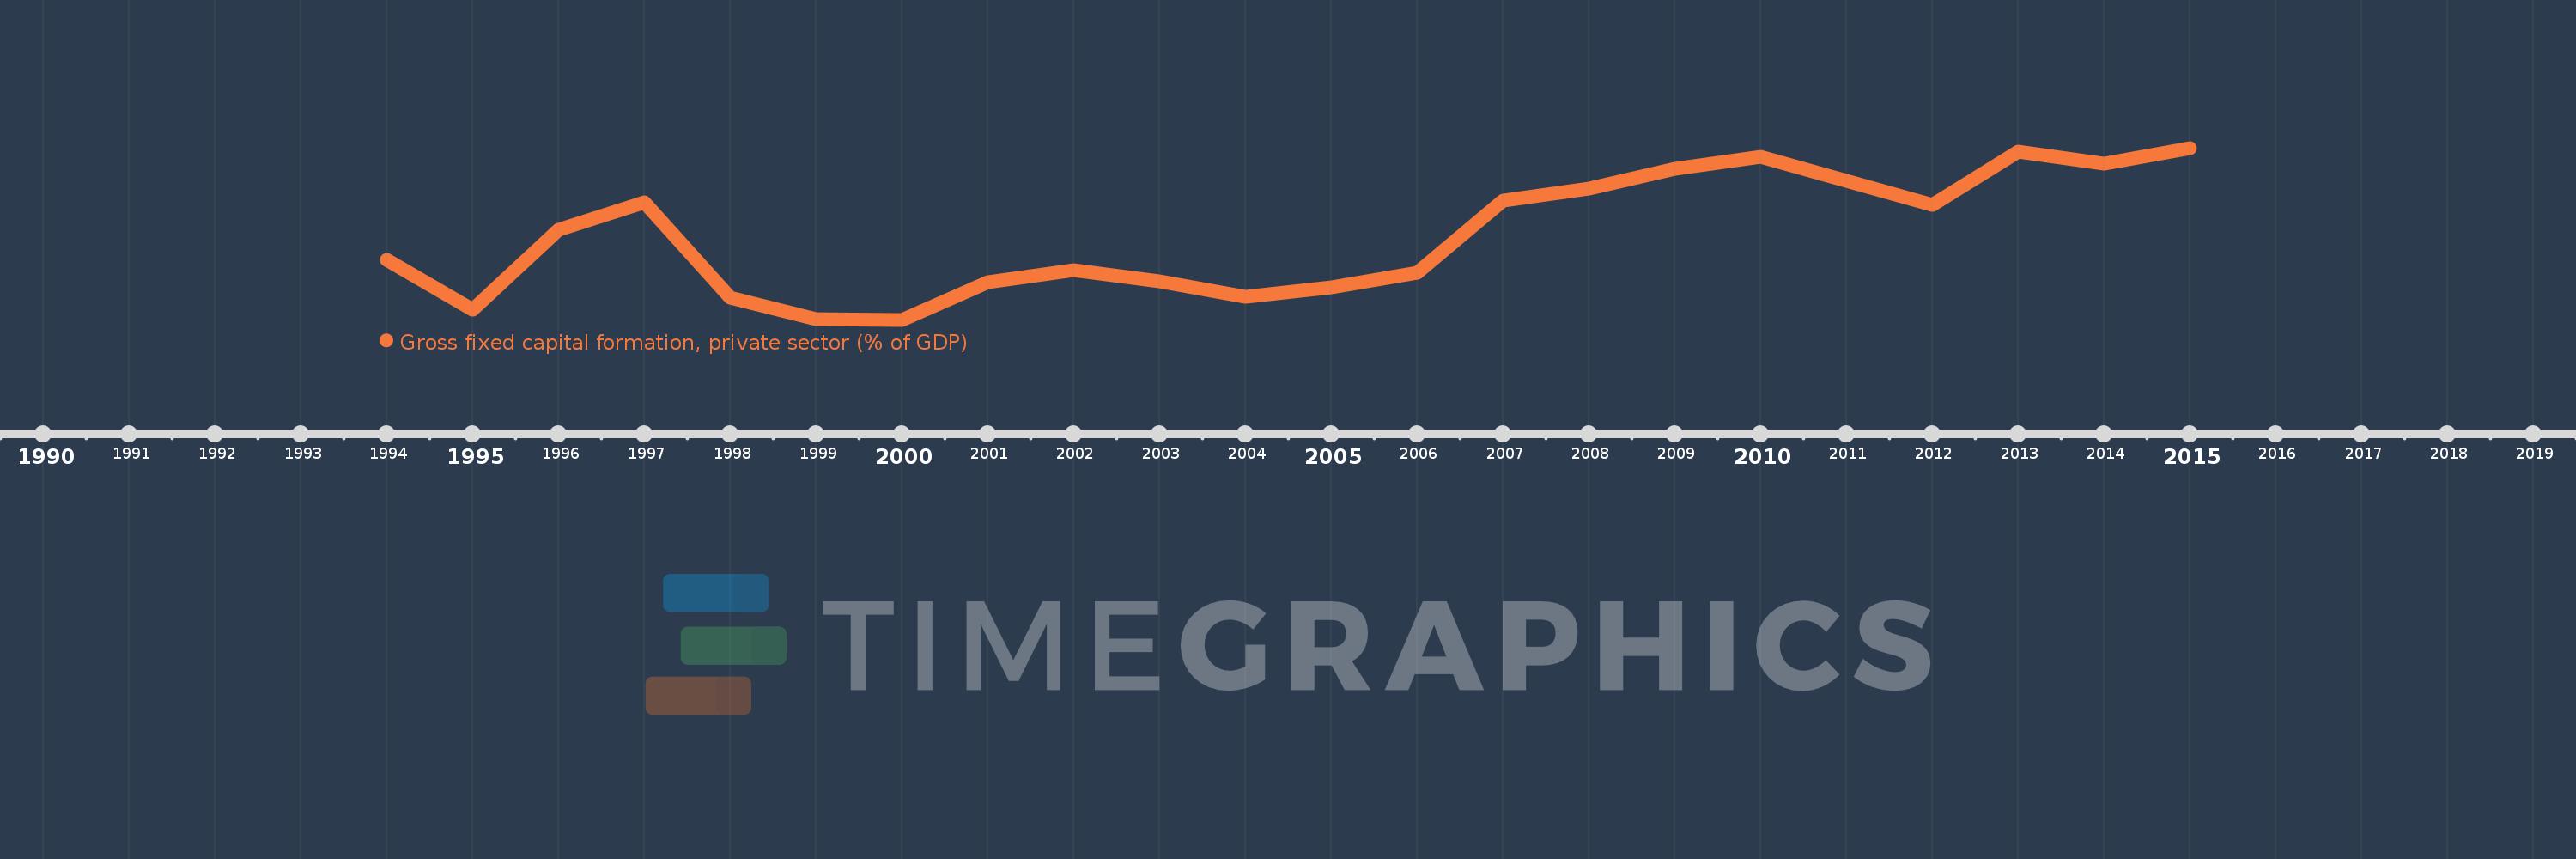
Gross fixed capital formation, private sector (% of GDP)
2015,2014,2013,2012,2011,2010,2009,2008,2007,2006,2005,2004,2003,2002,2001,2000,1999,1998,1997,1996,1995,1994
This statistics in other country:
Timeline:
This timeline shows a graph from 1994 to 2015 of Kyrgyz Republic. No data until 1993. Number of actual observations by date: 22.
Source name:
World Development Indicators
Source organization:
World Bank national accounts data, and OECD National Accounts data files.
Categories, topics:
Economy & Growth
Last updated:
apr 23, 2017
Indicators value changes by year
Maximum:
24.467
jan 1, 2015
At the date of observation
Value
Absolute change
Change from previous value
jan 1, 1994
12.802
+12.802
0.0%
jan 1, 1995
7.546
-5.256
-41.05%
jan 1, 1996
15.899
+8.353
110.69%
jan 1, 1997
18.8
+2.901
18.25%
jan 1, 1998
8.847
-9.953
-52.94%
jan 1, 1999
6.6
-2.247
-25.4%
jan 1, 2000
6.522
-0.078
-1.18%
jan 1, 2001
10.481
+3.959
60.69%
jan 1, 2002
11.72
+1.239
11.82%
jan 1, 2003
10.51
-1.21
-10.33%
jan 1, 2004
8.954
-1.555
-14.8%
jan 1, 2005
9.901
+0.946
10.57%
jan 1, 2006
11.417
+1.517
15.32%
jan 1, 2007
18.949
+7.532
65.97%
jan 1, 2008
20.261
+1.312
6.93%
jan 1, 2009
22.315
+2.053
10.14%
jan 1, 2010
23.549
+1.235
5.53%
jan 1, 2011
21.063
-2.486
-10.56%
jan 1, 2012
18.503
-2.56
-12.16%
jan 1, 2013
24.052
+5.549
29.99%
jan 1, 2014
22.868
-1.184
-4.92%
jan 1, 2015
24.467
+1.6
6.99%
Ranking of countries by current statistics by years


Comments: