29
/
en
AIzaSyAYiBZKx7MnpbEhh9jyipgxe19OcubqV5w
April 1, 2024
108575
Comoros
COM
true
2
1
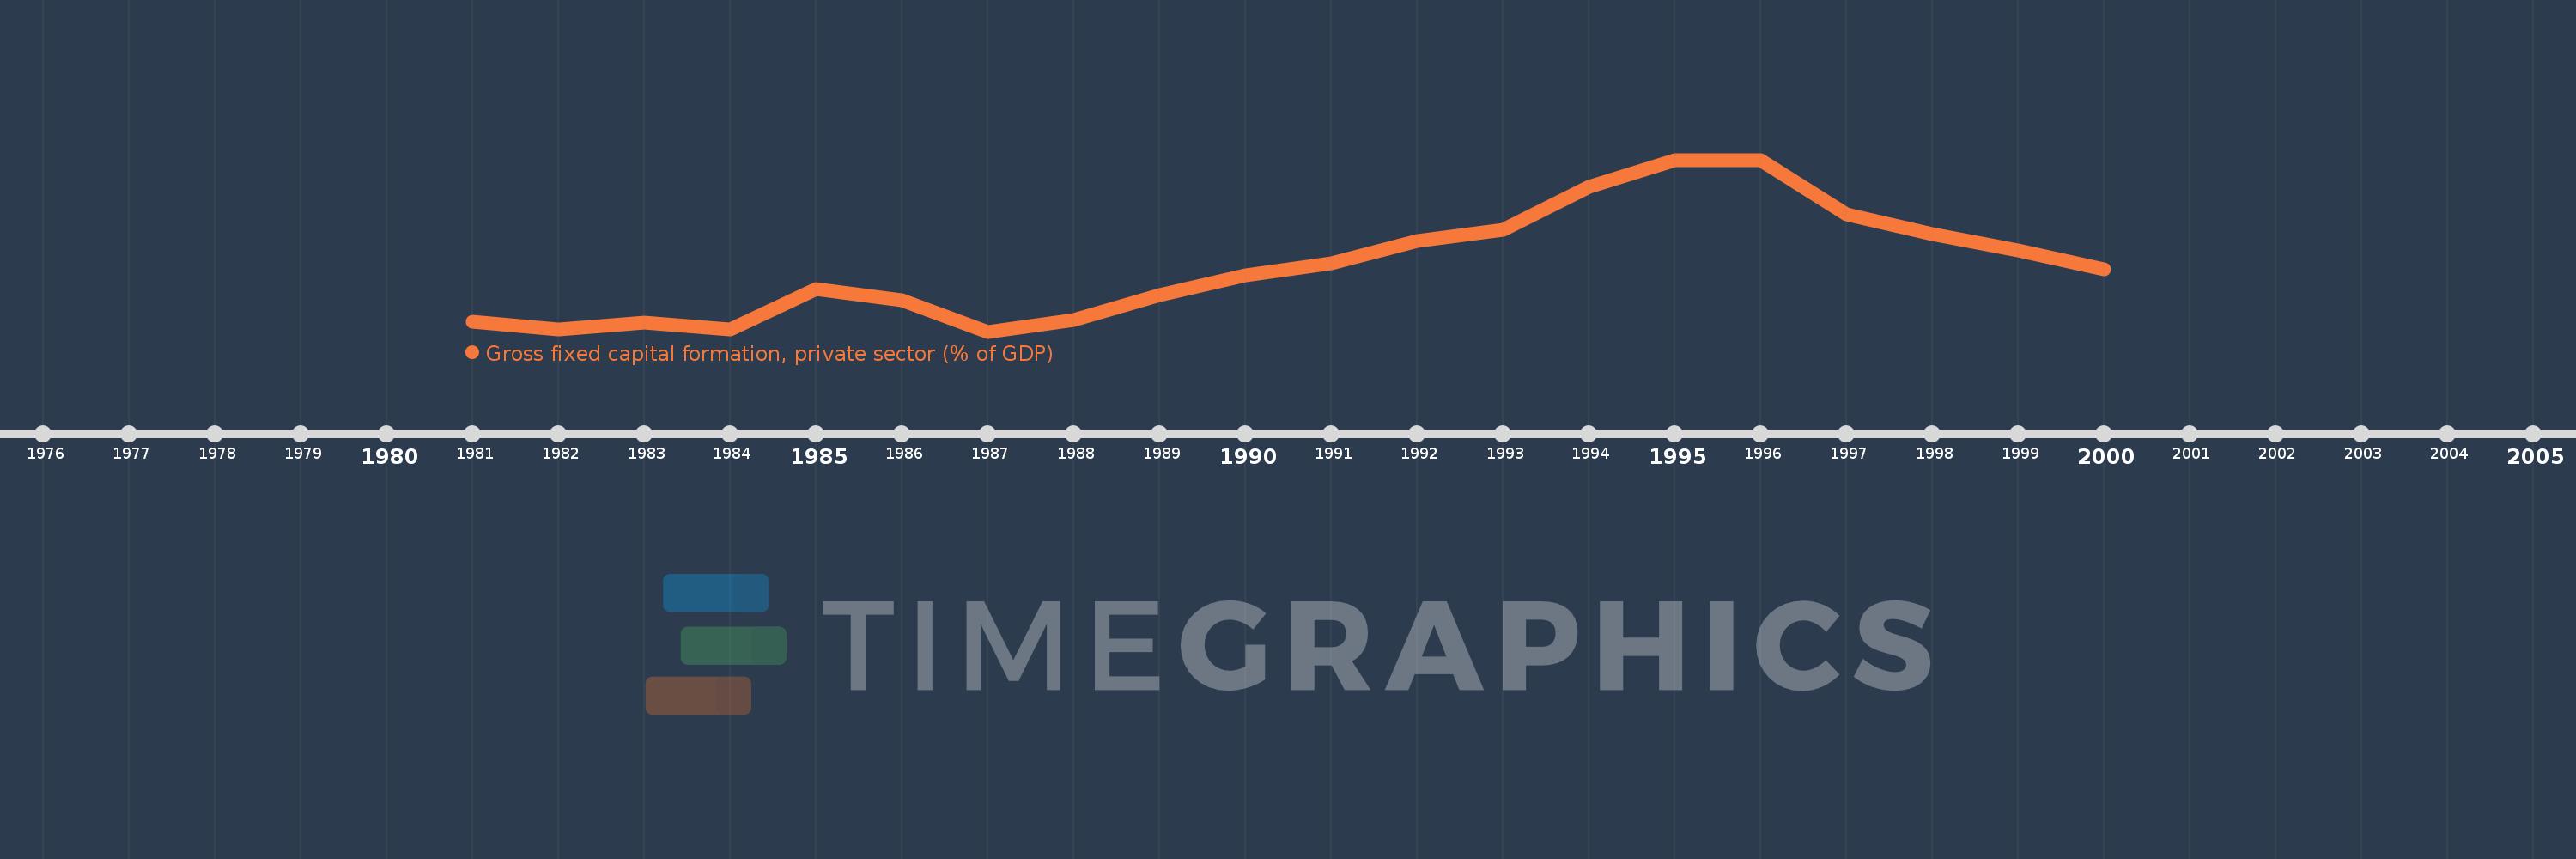
Gross fixed capital formation, private sector (% of GDP)
2000,1999,1998,1997,1996,1995,1994,1993,1992,1991,1990,1989,1988,1987,1986,1985,1984,1983,1982,1981
This statistics in other country:
Timeline:
This timeline shows a graph from 1981 to 2000 of Comoros. No data until 1980. Number of actual observations by date: 20.
Source name:
World Development Indicators
Source organization:
World Bank national accounts data, and OECD National Accounts data files.
Categories, topics:
Economy & Growth
Last updated:
apr 23, 2017
Indicators value changes by year
At the date of observation
Value
Absolute change
Change from previous value
jan 1, 1982
5.111
-0.189
-3.57%
jan 1, 1983
5.266
+0.155
3.03%
jan 1, 1984
5.102
-0.164
-3.12%
jan 1, 1985
6.083
+0.981
19.23%
jan 1, 1986
5.809
-0.274
-4.5%
jan 1, 1987
5.061
-0.748
-12.87%
jan 1, 1988
5.332
+0.271
5.36%
jan 1, 1989
5.928
+0.595
11.16%
jan 1, 1990
6.407
+0.48
8.09%
jan 1, 1991
6.681
+0.274
4.27%
jan 1, 1992
7.214
+0.533
7.98%
jan 1, 1993
7.487
+0.273
3.78%
jan 1, 1994
8.5
+1.014
13.54%
jan 1, 1995
9.153
+0.653
7.68%
jan 1, 1996
9.14
-0.013
-0.14%
jan 1, 1997
7.851
-1.289
-14.1%
jan 1, 1998
7.378
-0.473
-6.03%
jan 1, 1999
6.986
-0.392
-5.31%
jan 1, 2000
6.543
-0.443
-6.34%
Ranking of countries by current statistics by years


Comments: