29
/
en
AIzaSyAYiBZKx7MnpbEhh9jyipgxe19OcubqV5w
April 1, 2024
235836
Senegal
SEN
true
2
1
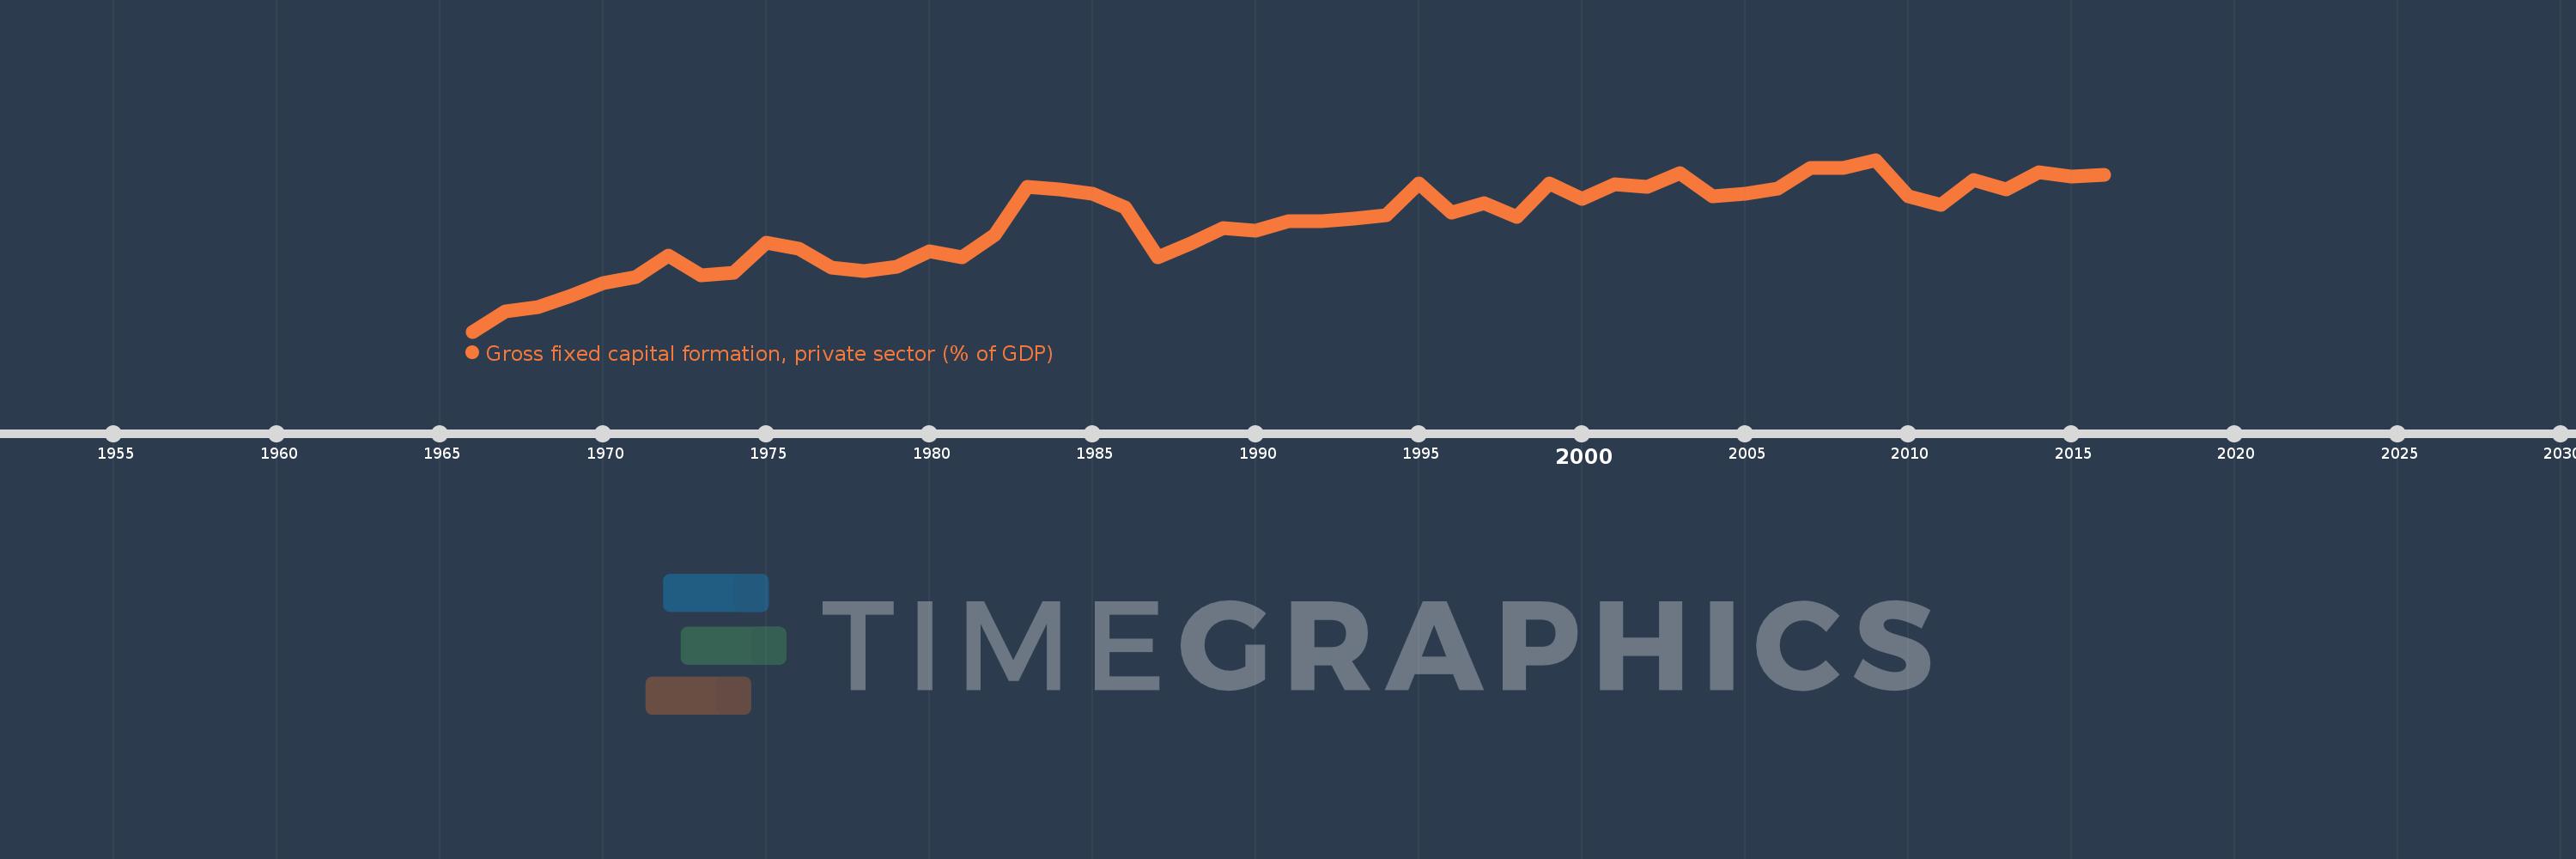
Gross fixed capital formation, private sector (% of GDP)
2016,2015,2014,2013,2012,2011,2010,2009,2008,2007,2006,2005,2004,2003,2002,2001,2000,1999,1998,1997,1996,1995,1994,1993,1992,1991,1990,1989,1988,1987,1986,1985,1984,1983,1982,1981,1980,1979,1978,1977,1976,1975,1974,1973,1972,1971,1970,1969,1968,1967,1966
This statistics in other country:
Timeline:
This timeline shows a graph from 1966 to 2016 of Senegal. No data until 1965. Number of actual observations by date: 51.
Source name:
World Development Indicators
Source organization:
World Bank national accounts data, and OECD National Accounts data files.
Categories, topics:
Economy & Growth
Last updated:
apr 23, 2017
Indicators value changes by year
Maximum:
20.613
jan 1, 2009
At the date of observation
Value
Absolute change
Change from previous value
jan 1, 1966
1.817
+1.817
0.0%
jan 1, 1967
4.019
+2.203
121.26%
jan 1, 1968
4.518
+0.498
12.39%
jan 1, 1969
5.757
+1.24
27.44%
jan 1, 1970
7.132
+1.375
23.88%
jan 1, 1971
7.779
+0.647
9.08%
jan 1, 1972
10.171
+2.392
30.75%
jan 1, 1973
8.007
-2.165
-21.28%
jan 1, 1974
8.292
+0.285
3.56%
jan 1, 1975
11.536
+3.245
39.13%
jan 1, 1976
10.847
-0.689
-5.97%
jan 1, 1977
8.782
-2.066
-19.04%
jan 1, 1978
8.449
-0.332
-3.78%
jan 1, 1979
8.915
+0.466
5.51%
jan 1, 1980
10.583
+1.669
18.72%
jan 1, 1981
9.918
-0.665
-6.29%
jan 1, 1982
12.43
+2.512
25.32%
jan 1, 1983
17.616
+5.186
41.72%
jan 1, 1984
17.365
-0.251
-1.42%
jan 1, 1985
16.855
-0.51
-2.94%
jan 1, 1986
15.398
-1.457
-8.64%
jan 1, 1987
9.978
-5.421
-35.2%
jan 1, 1988
11.456
+1.478
14.82%
jan 1, 1989
13.124
+1.668
14.56%
jan 1, 1990
12.846
-0.278
-2.12%
jan 1, 1991
13.92
+1.074
8.36%
jan 1, 1992
13.94
+0.02
0.15%
jan 1, 1993
14.135
+0.195
1.4%
jan 1, 1994
14.535
+0.399
2.82%
jan 1, 1995
18.054
+3.519
24.21%
jan 1, 1996
14.859
-3.195
-17.7%
jan 1, 1997
15.857
+0.998
6.72%
jan 1, 1998
14.399
-1.457
-9.19%
jan 1, 1999
18.005
+3.606
25.04%
jan 1, 2000
16.367
-1.638
-9.1%
jan 1, 2001
17.893
+1.526
9.32%
jan 1, 2002
17.673
-0.22
-1.23%
jan 1, 2003
19.162
+1.489
8.42%
jan 1, 2004
16.621
-2.541
-13.26%
jan 1, 2005
16.943
+0.322
1.94%
jan 1, 2006
17.43
+0.486
2.87%
jan 1, 2007
19.766
+2.336
13.4%
jan 1, 2008
19.691
-0.075
-0.38%
jan 1, 2009
20.613
+0.922
4.68%
jan 1, 2010
16.642
-3.971
-19.26%
jan 1, 2011
15.648
-0.995
-5.98%
jan 1, 2012
18.443
+2.795
17.86%
jan 1, 2013
17.385
-1.058
-5.74%
jan 1, 2014
19.228
+1.843
10.6%
jan 1, 2015
18.802
-0.425
-2.21%
jan 1, 2016
18.987
+0.185
0.98%
Ranking of countries by current statistics by years


Comments: