29
/
en
AIzaSyAYiBZKx7MnpbEhh9jyipgxe19OcubqV5w
April 1, 2024
277738
Uruguay
URY
true
2
1
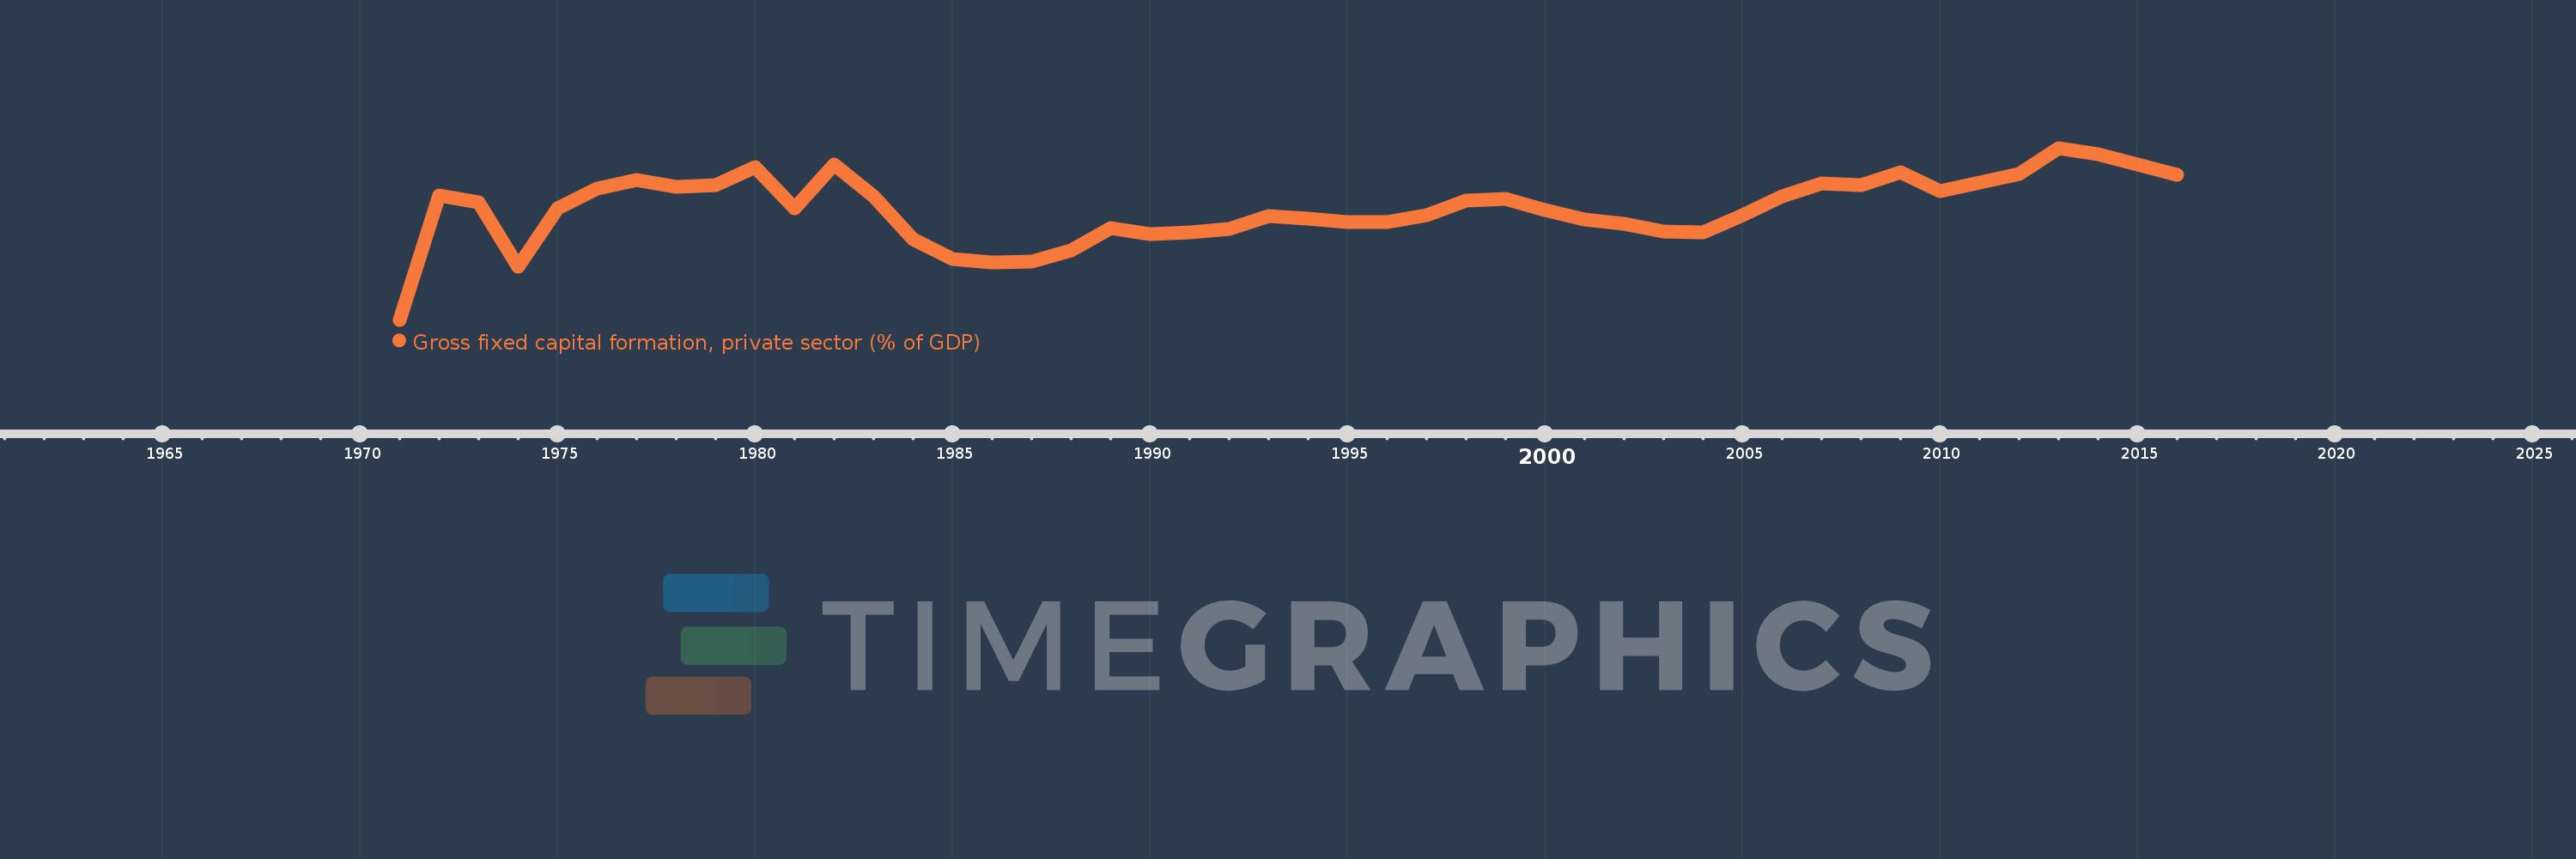
Gross fixed capital formation, private sector (% of GDP)
2016,2015,2014,2013,2012,2011,2010,2009,2008,2007,2006,2005,2004,2003,2002,2001,2000,1999,1998,1997,1996,1995,1994,1993,1992,1991,1990,1989,1988,1987,1986,1985,1984,1983,1982,1981,1980,1979,1978,1977,1976,1975,1974,1973,1972,1971
This statistics in other country:
Timeline:
This timeline shows a graph from 1971 to 2016 of Uruguay. No data until 1970. Number of actual observations by date: 46.
Source name:
World Development Indicators
Source organization:
World Bank national accounts data, and OECD National Accounts data files.
Categories, topics:
Economy & Growth
Last updated:
apr 23, 2017
Indicators value changes by year
Maximum:
18.313
jan 1, 2013
At the date of observation
Value
Absolute change
Change from previous value
jan 1, 1972
13.286
+13.286
%
jan 1, 1973
12.511
-0.776
-5.84%
jan 1, 1974
5.65
-6.86
-54.84%
jan 1, 1975
11.913
+6.263
110.84%
jan 1, 1976
13.955
+2.042
17.14%
jan 1, 1977
14.882
+0.927
6.64%
jan 1, 1978
14.205
-0.677
-4.55%
jan 1, 1979
14.356
+0.151
1.06%
jan 1, 1980
16.226
+1.871
13.03%
jan 1, 1981
11.87
-4.356
-26.85%
jan 1, 1982
16.564
+4.693
39.54%
jan 1, 1983
13.163
-3.401
-20.53%
jan 1, 1984
8.552
-4.611
-35.03%
jan 1, 1985
6.455
-2.097
-24.52%
jan 1, 1986
6.142
-0.313
-4.85%
jan 1, 1987
6.233
+0.091
1.48%
jan 1, 1988
7.385
+1.152
18.48%
jan 1, 1989
9.811
+2.426
32.85%
jan 1, 1990
9.093
-0.718
-7.32%
jan 1, 1991
9.347
+0.254
2.79%
jan 1, 1992
9.637
+0.29
3.1%
jan 1, 1993
11.054
+1.418
14.71%
jan 1, 1994
10.822
-0.232
-2.1%
jan 1, 1995
10.451
-0.371
-3.43%
jan 1, 1996
10.435
-0.017
-0.16%
jan 1, 1997
11.105
+0.67
6.42%
jan 1, 1998
12.676
+1.571
14.15%
jan 1, 1999
12.859
+0.183
1.44%
jan 1, 2000
11.663
-1.196
-9.3%
jan 1, 2001
10.66
-1.002
-8.59%
jan 1, 2002
10.198
-0.463
-4.34%
jan 1, 2003
9.422
-0.776
-7.61%
jan 1, 2004
9.278
-0.144
-1.53%
jan 1, 2005
11.107
+1.829
19.72%
jan 1, 2006
13.17
+2.063
18.57%
jan 1, 2007
14.563
+1.392
10.57%
jan 1, 2008
14.384
-0.179
-1.23%
jan 1, 2009
15.709
+1.326
9.22%
jan 1, 2010
13.695
-2.015
-12.82%
jan 1, 2011
14.64
+0.945
6.9%
jan 1, 2012
15.497
+0.858
5.86%
jan 1, 2013
18.313
+2.815
18.17%
jan 1, 2014
17.63
-0.682
-3.73%
jan 1, 2015
16.566
-1.064
-6.04%
jan 1, 2016
15.43
-1.136
-6.86%
Ranking of countries by current statistics by years


Comments: