29
/
en
AIzaSyAYiBZKx7MnpbEhh9jyipgxe19OcubqV5w
April 1, 2024
128363
Eritrea
ERI
true
2
1
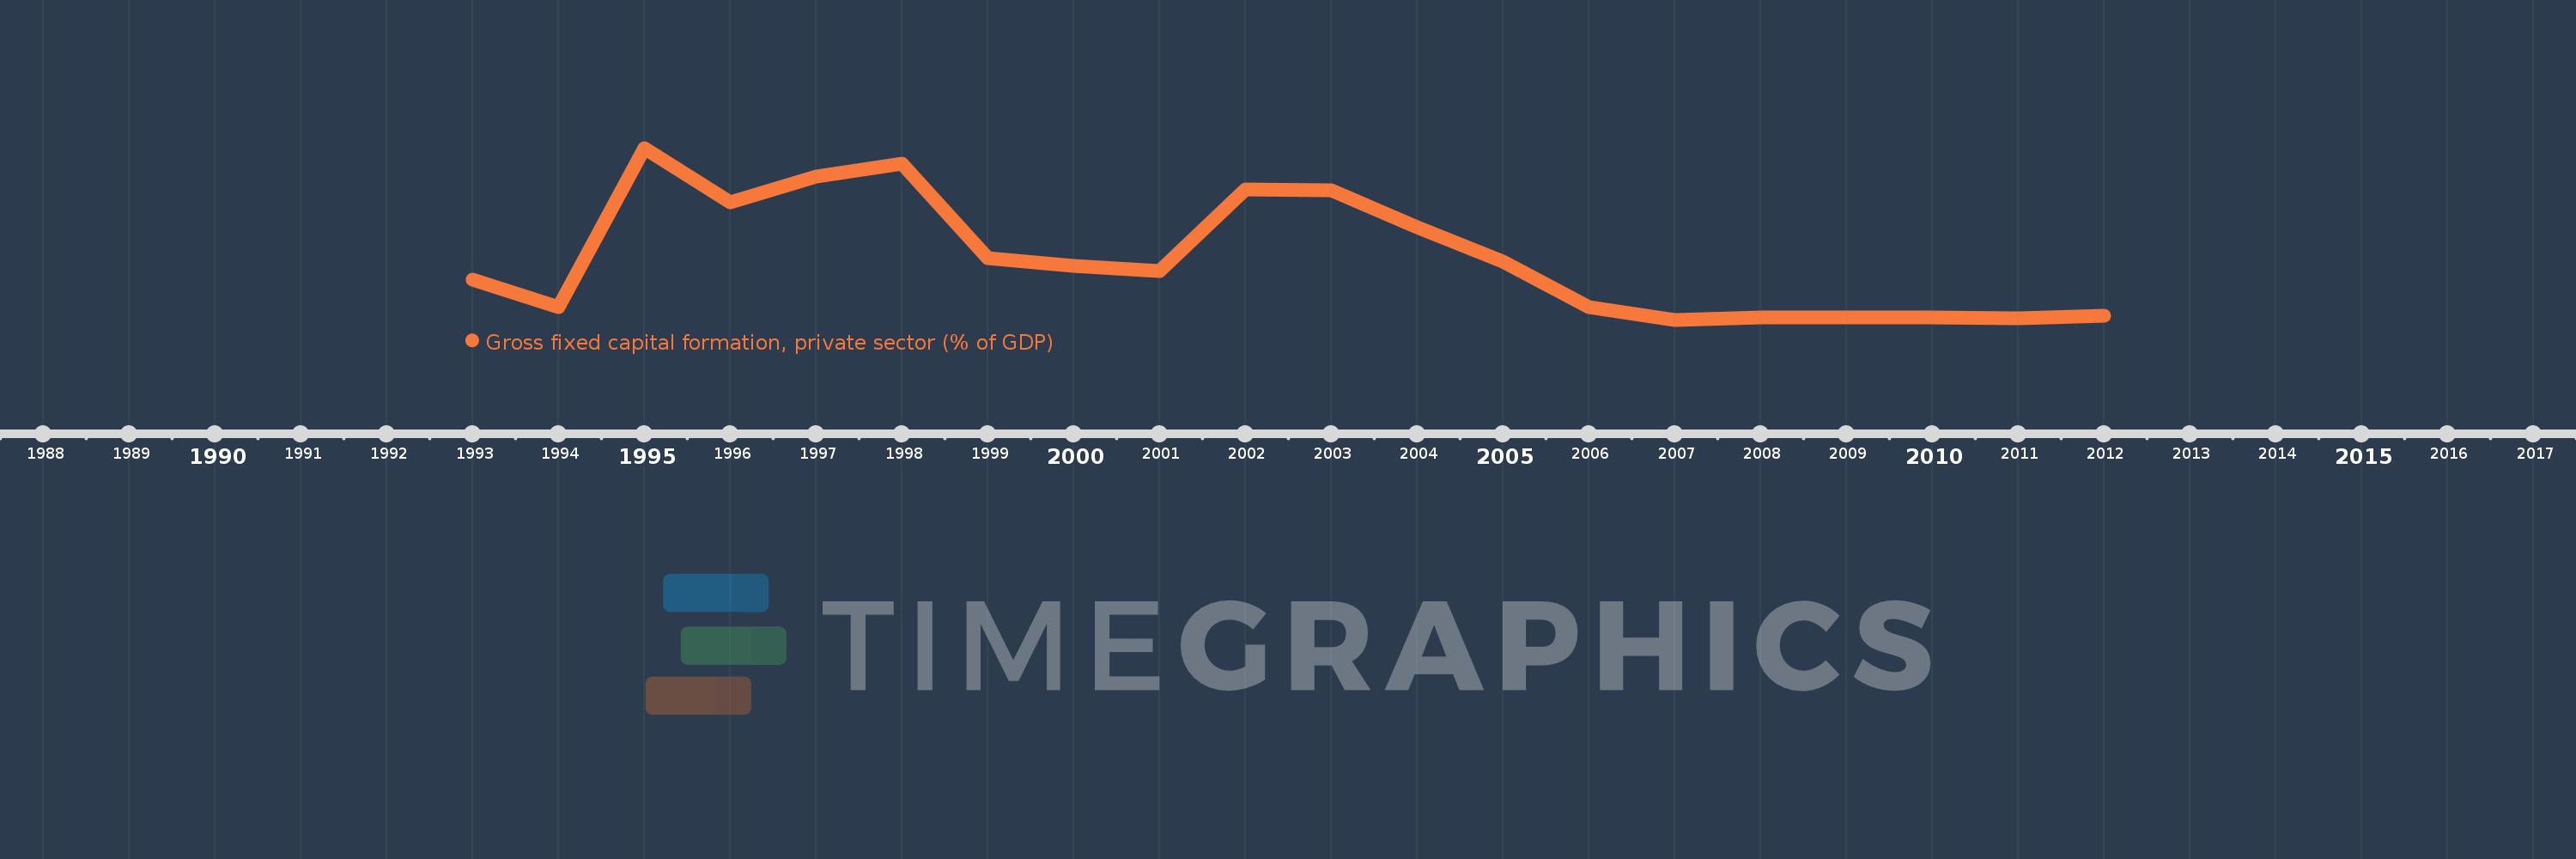
Gross fixed capital formation, private sector (% of GDP)
2012,2011,2010,2009,2008,2007,2006,2005,2004,2003,2002,2001,2000,1999,1998,1997,1996,1995,1994,1993
This statistics in other country:
Timeline:
This timeline shows a graph from 1993 to 2012 of Eritrea. No data until 1992. Number of actual observations by date: 20.
Source name:
World Development Indicators
Source organization:
World Bank national accounts data, and OECD National Accounts data files.
Categories, topics:
Economy & Growth
Last updated:
apr 23, 2017
Indicators value changes by year
Maximum:
14.329
jan 1, 1995
At the date of observation
Value
Absolute change
Change from previous value
jan 1, 1993
4.55
+4.55
0.0%
jan 1, 1994
2.481
-2.069
-45.48%
jan 1, 1995
14.329
+11.848
477.55%
jan 1, 1996
10.267
-4.062
-28.35%
jan 1, 1997
12.215
+1.948
18.97%
jan 1, 1998
13.167
+0.952
7.8%
jan 1, 1999
6.098
-7.069
-53.69%
jan 1, 2000
5.53
-0.567
-9.3%
jan 1, 2001
5.143
-0.387
-7.0%
jan 1, 2002
11.269
+6.126
119.1%
jan 1, 2003
11.182
-0.087
-0.77%
jan 1, 2004
8.445
-2.737
-24.48%
jan 1, 2005
5.875
-2.57
-30.44%
jan 1, 2006
2.47
-3.405
-57.96%
jan 1, 2007
1.533
-0.937
-37.92%
jan 1, 2008
1.701
+0.167
10.92%
jan 1, 2009
1.731
+0.03
1.76%
jan 1, 2010
1.715
-0.016
-0.9%
jan 1, 2011
1.654
-0.061
-3.58%
jan 1, 2012
1.855
+0.202
12.21%
Ranking of countries by current statistics by years


Comments: