29
/
en
AIzaSyAYiBZKx7MnpbEhh9jyipgxe19OcubqV5w
April 1, 2024
166211
Kazakhstan
KAZ
true
2
1
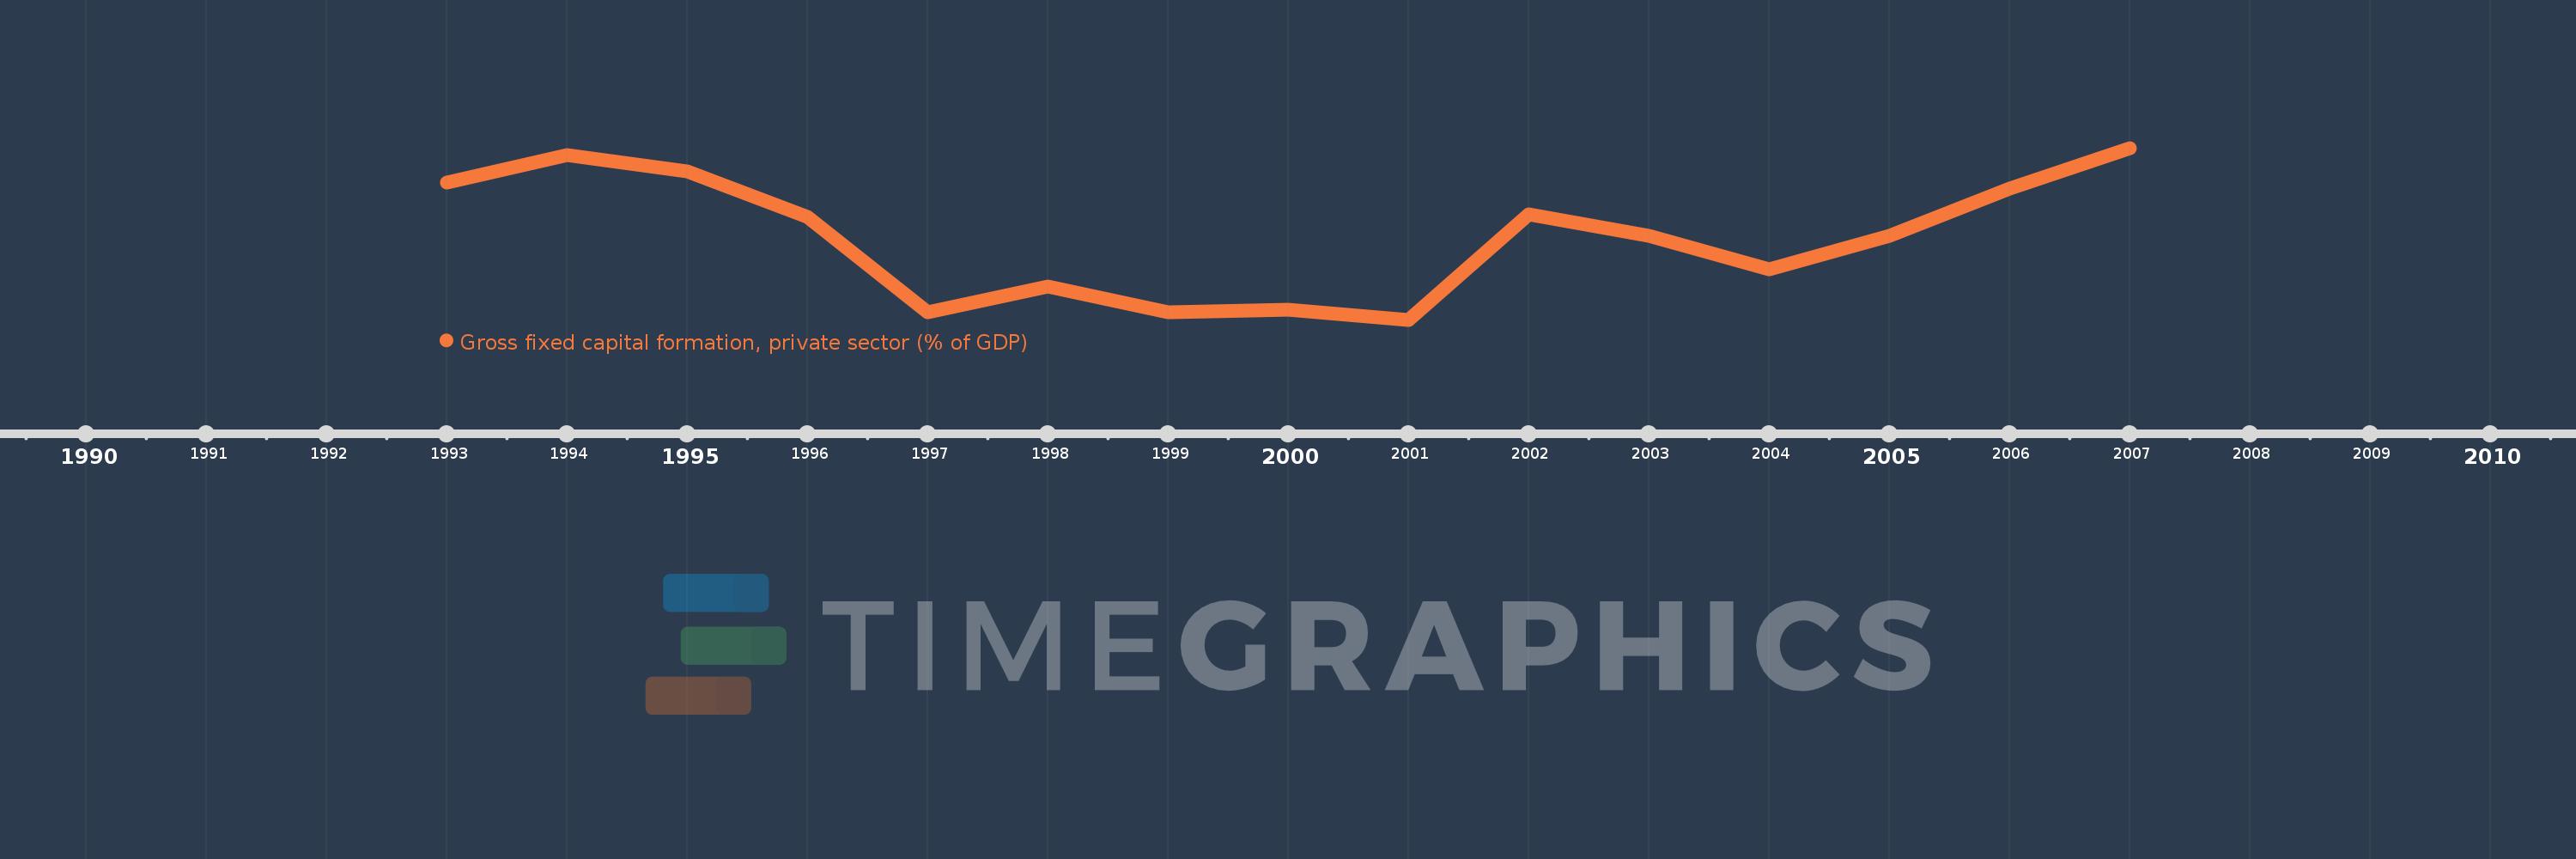
Gross fixed capital formation, private sector (% of GDP)
2007,2006,2005,2004,2003,2002,2001,2000,1999,1998,1997,1996,1995,1994,1993
This statistics in other country:
Timeline:
This timeline shows a graph from 1993 to 2007 of Kazakhstan. No data until 1992. Number of actual observations by date: 15.
Source name:
World Development Indicators
Source organization:
World Bank national accounts data, and OECD National Accounts data files.
Categories, topics:
Economy & Growth
Last updated:
apr 23, 2017
Indicators value changes by year
Maximum:
25.675
jan 1, 2007
At the date of observation
Value
Absolute change
Change from previous value
jan 1, 1993
23.715
+23.715
0.0%
jan 1, 1994
25.27
+1.555
6.56%
jan 1, 1995
24.371
-0.899
-3.56%
jan 1, 1996
21.798
-2.572
-10.55%
jan 1, 1997
16.397
-5.401
-24.78%
jan 1, 1998
17.834
+1.437
8.77%
jan 1, 1999
16.382
-1.452
-8.14%
jan 1, 2000
16.505
+0.123
0.75%
jan 1, 2001
15.96
-0.546
-3.31%
jan 1, 2002
21.919
+5.959
37.34%
jan 1, 2003
20.715
-1.204
-5.49%
jan 1, 2004
18.827
-1.888
-9.11%
jan 1, 2005
20.691
+1.865
9.91%
jan 1, 2006
23.395
+2.704
13.07%
jan 1, 2007
25.675
+2.28
9.75%
Ranking of countries by current statistics by years


Comments: