29
/
en
AIzaSyAYiBZKx7MnpbEhh9jyipgxe19OcubqV5w
April 1, 2024
258383
Syrian Arab Republic
SYR
true
2
1
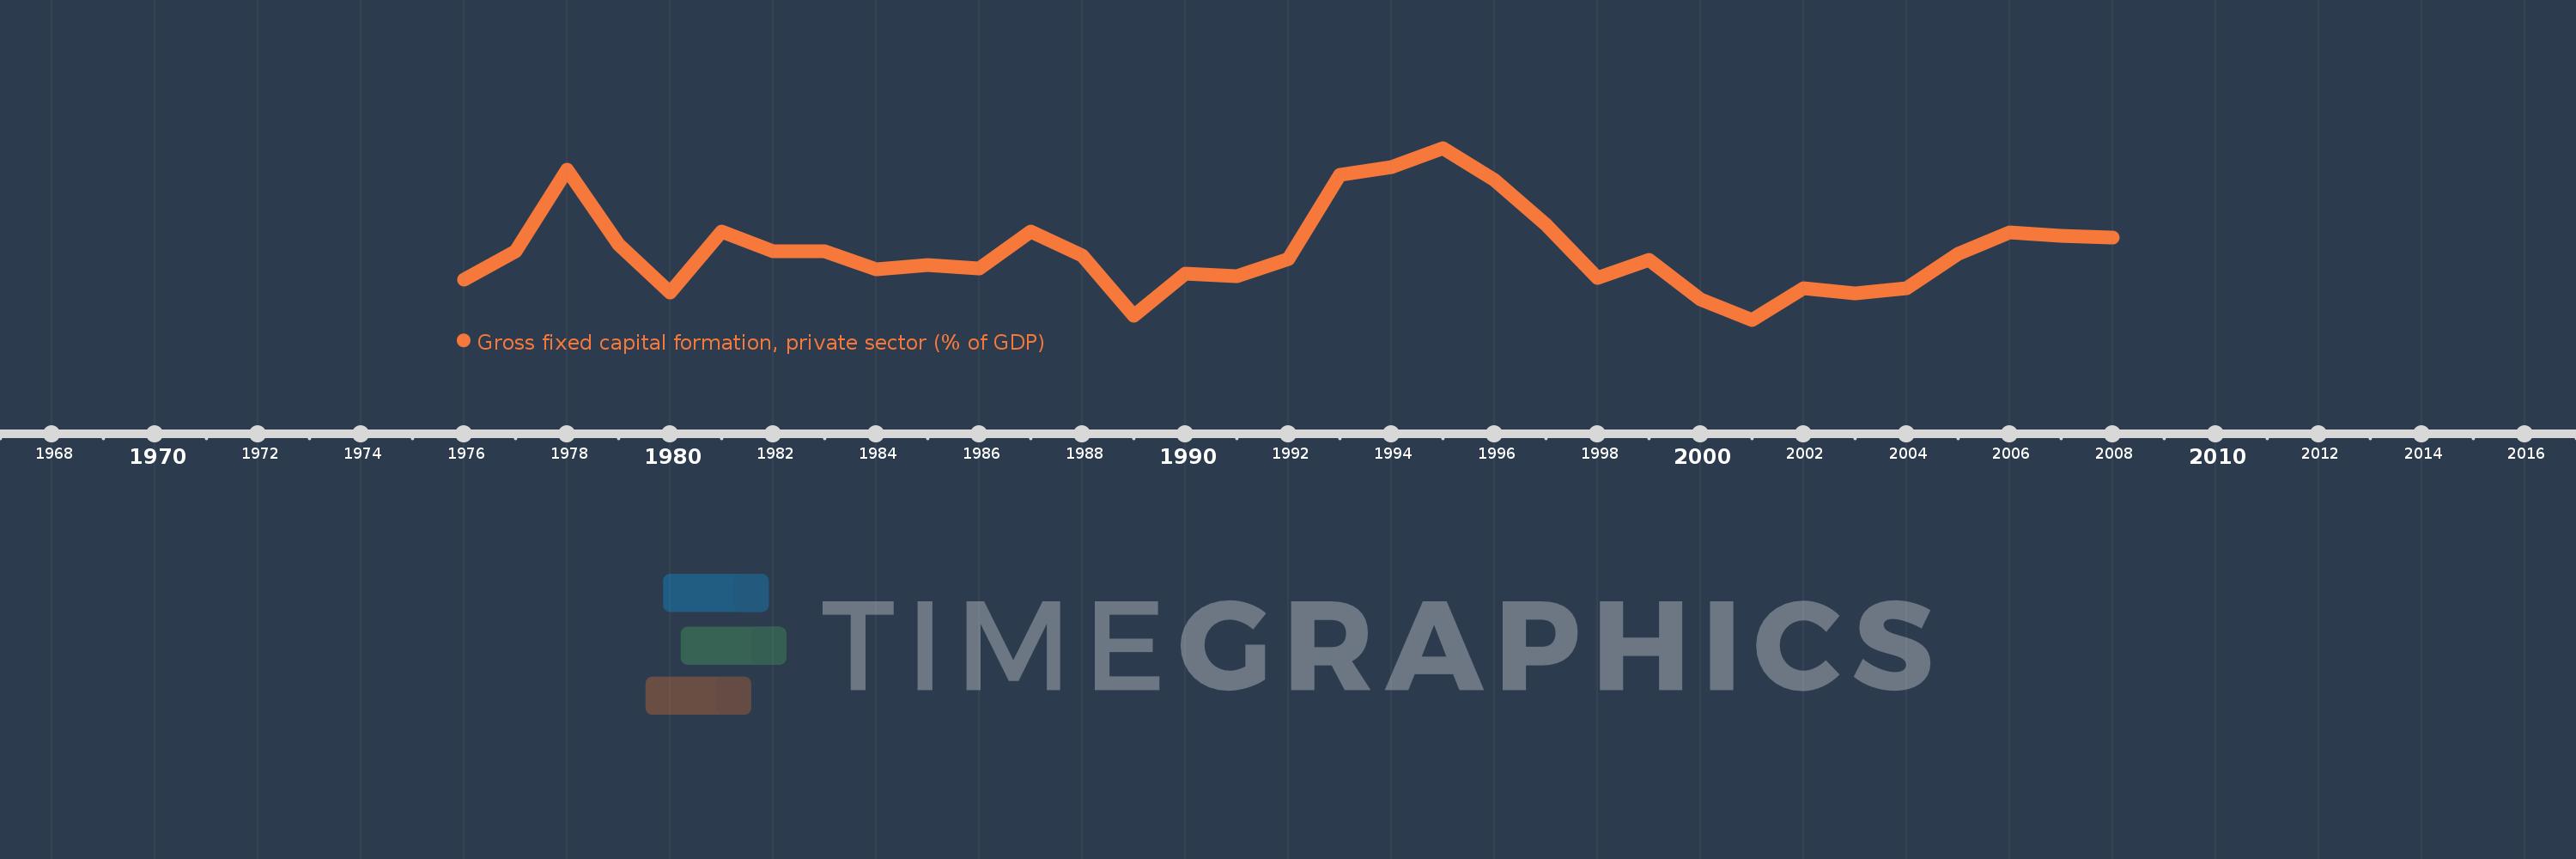
Gross fixed capital formation, private sector (% of GDP)
2008,2007,2006,2005,2004,2003,2002,2001,2000,1999,1998,1997,1996,1995,1994,1993,1992,1991,1990,1989,1988,1987,1986,1985,1984,1983,1982,1981,1980,1979,1978,1977,1976
This statistics in other country:
Timeline:
This timeline shows a graph from 1976 to 2008 of Syrian Arab Republic. No data until 1975. Number of actual observations by date: 33.
Source name:
World Development Indicators
Source organization:
World Bank national accounts data, and OECD National Accounts data files.
Categories, topics:
Economy & Growth
Last updated:
apr 23, 2017
Indicators value changes by year
Maximum:
17.368
jan 1, 1995
At the date of observation
Value
Absolute change
Change from previous value
jan 1, 1976
8.853
+8.853
0.0%
jan 1, 1977
10.674
+1.821
20.56%
jan 1, 1978
15.979
+5.305
49.7%
jan 1, 1979
11.125
-4.854
-30.38%
jan 1, 1980
8.037
-3.088
-27.75%
jan 1, 1981
11.972
+3.935
48.96%
jan 1, 1982
10.722
-1.25
-10.44%
jan 1, 1983
10.689
-0.033
-0.31%
jan 1, 1984
9.522
-1.167
-10.92%
jan 1, 1985
9.827
+0.306
3.21%
jan 1, 1986
9.583
-0.244
-2.49%
jan 1, 1987
11.951
+2.368
24.71%
jan 1, 1988
10.408
-1.543
-12.91%
jan 1, 1989
6.532
-3.876
-37.24%
jan 1, 1990
9.283
+2.751
42.12%
jan 1, 1991
9.102
-0.181
-1.95%
jan 1, 1992
10.187
+1.085
11.92%
jan 1, 1993
15.66
+5.473
53.73%
jan 1, 1994
16.126
+0.465
2.97%
jan 1, 1995
17.368
+1.243
7.7%
jan 1, 1996
15.3
-2.068
-11.91%
jan 1, 1997
12.4
-2.9
-18.95%
jan 1, 1998
9.0
-3.4
-27.42%
jan 1, 1999
10.145
+1.145
12.72%
jan 1, 2000
7.596
-2.548
-25.12%
jan 1, 2001
6.279
-1.317
-17.34%
jan 1, 2002
8.319
+2.039
32.48%
jan 1, 2003
8.005
-0.313
-3.76%
jan 1, 2004
8.337
+0.331
4.14%
jan 1, 2005
10.512
+2.175
26.09%
jan 1, 2006
11.921
+1.409
13.41%
jan 1, 2007
11.69
-0.231
-1.94%
jan 1, 2008
11.588
-0.102
-0.87%
Ranking of countries by current statistics by years


Comments: