29
/
en
AIzaSyAYiBZKx7MnpbEhh9jyipgxe19OcubqV5w
April 1, 2024
75063
Azerbaijan
AZE
true
2
1
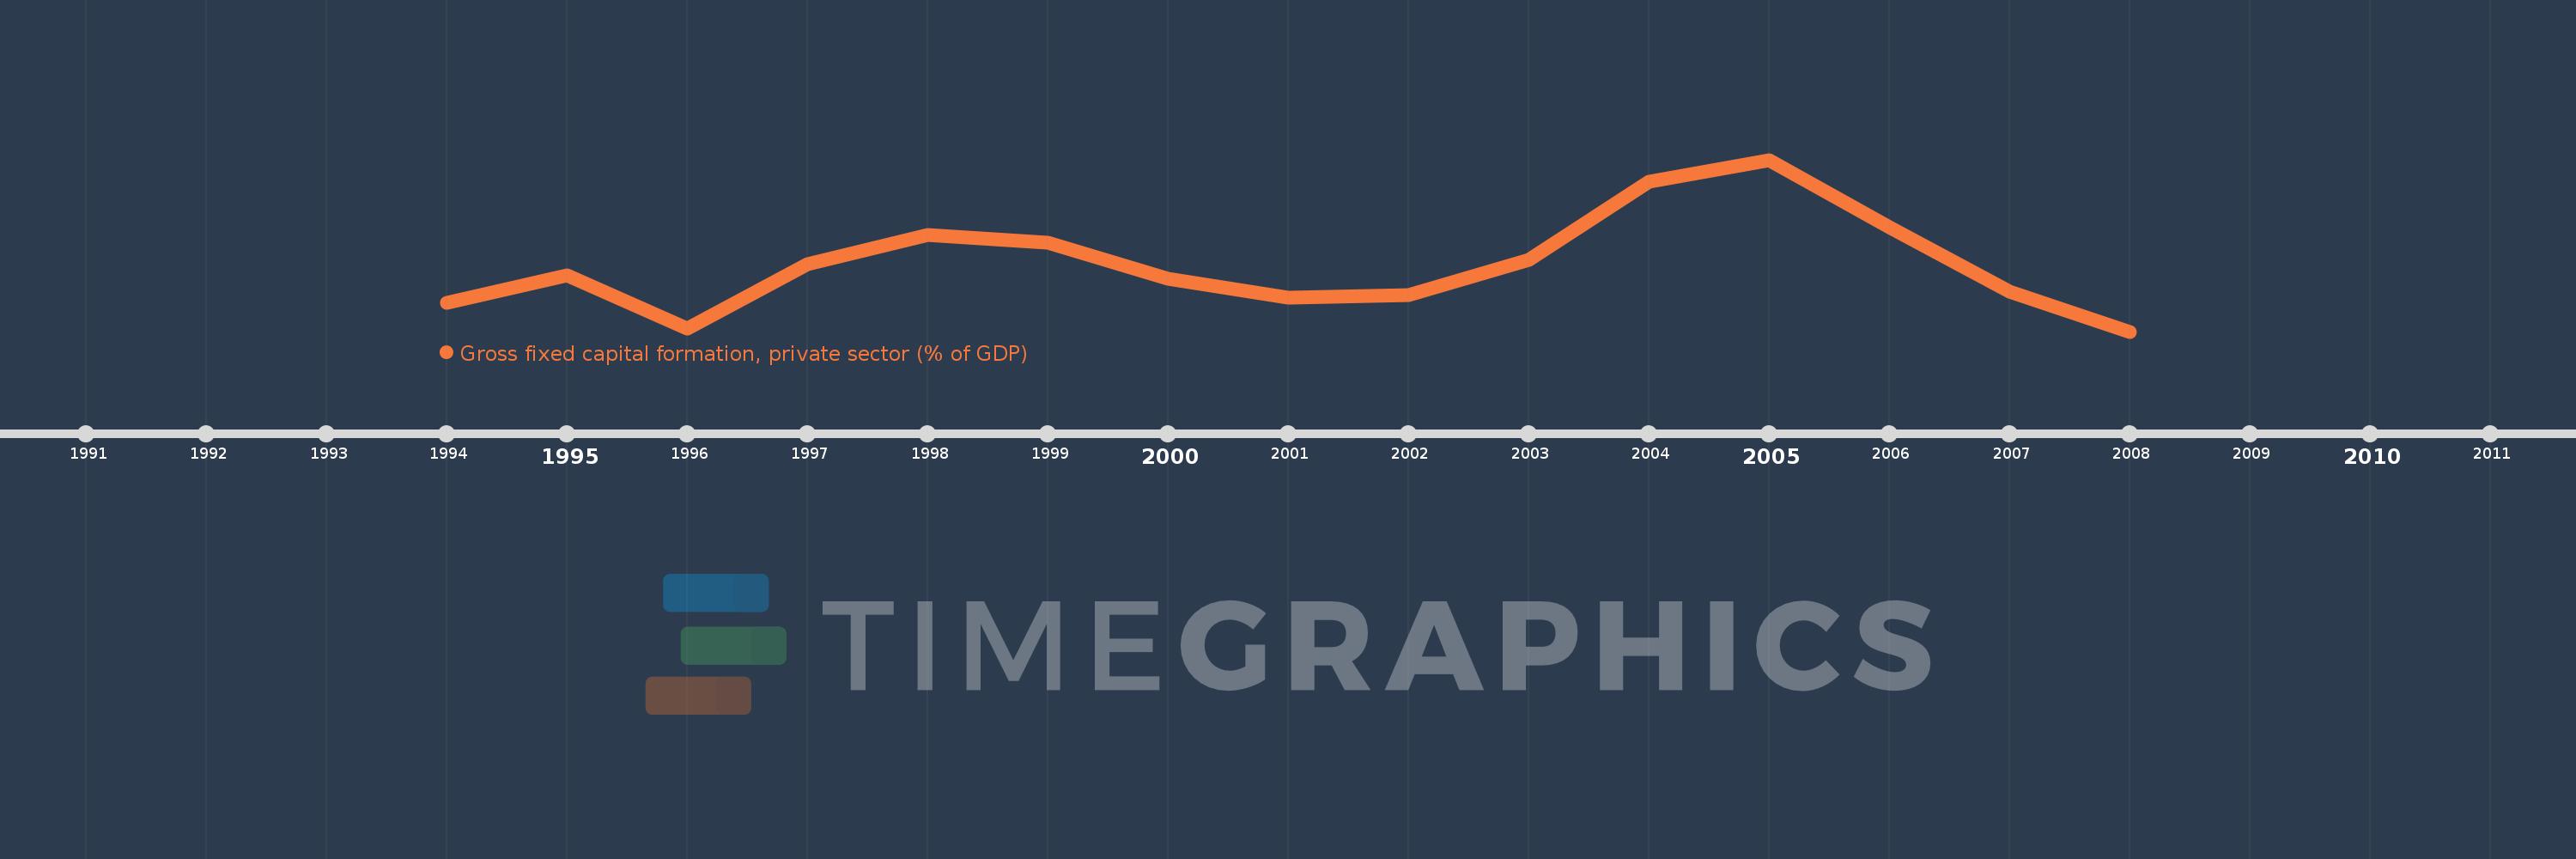
Gross fixed capital formation, private sector (% of GDP)
2008,2007,2006,2005,2004,2003,2002,2001,2000,1999,1998,1997,1996,1995,1994
This statistics in other country:
Timeline:
This timeline shows a graph from 1994 to 2008 of Azerbaijan. No data until 1993. Number of actual observations by date: 15.
Source name:
World Development Indicators
Source organization:
World Bank national accounts data, and OECD National Accounts data files.
Categories, topics:
Economy & Growth
Last updated:
apr 23, 2017
Indicators value changes by year
Minimum:
11.771
jan 1, 2008
Maximum:
54.065
jan 1, 2005
At the date of observation
Value
Absolute change
Change from previous value
jan 1, 1994
18.787
+18.787
0.0%
jan 1, 1995
25.659
+6.871
36.57%
jan 1, 1996
12.473
-13.186
-51.39%
jan 1, 1997
28.332
+15.859
127.15%
jan 1, 1998
35.597
+7.265
25.64%
jan 1, 1999
33.68
-1.917
-5.39%
jan 1, 2000
24.841
-8.839
-26.24%
jan 1, 2001
20.114
-4.727
-19.03%
jan 1, 2002
20.788
+0.674
3.35%
jan 1, 2003
29.442
+8.653
41.63%
jan 1, 2004
48.644
+19.203
65.22%
jan 1, 2005
54.065
+5.421
11.14%
jan 1, 2006
37.497
-16.568
-30.64%
jan 1, 2007
21.525
-15.973
-42.6%
jan 1, 2008
11.771
-9.754
-45.32%
Ranking of countries by current statistics by years


Comments: