30
/
AIzaSyAYiBZKx7MnpbEhh9jyipgxe19OcubqV5w
April 1, 2024
50064
Middle East & North Africa (IDA & IBRD countries)
TMN
false
2
1
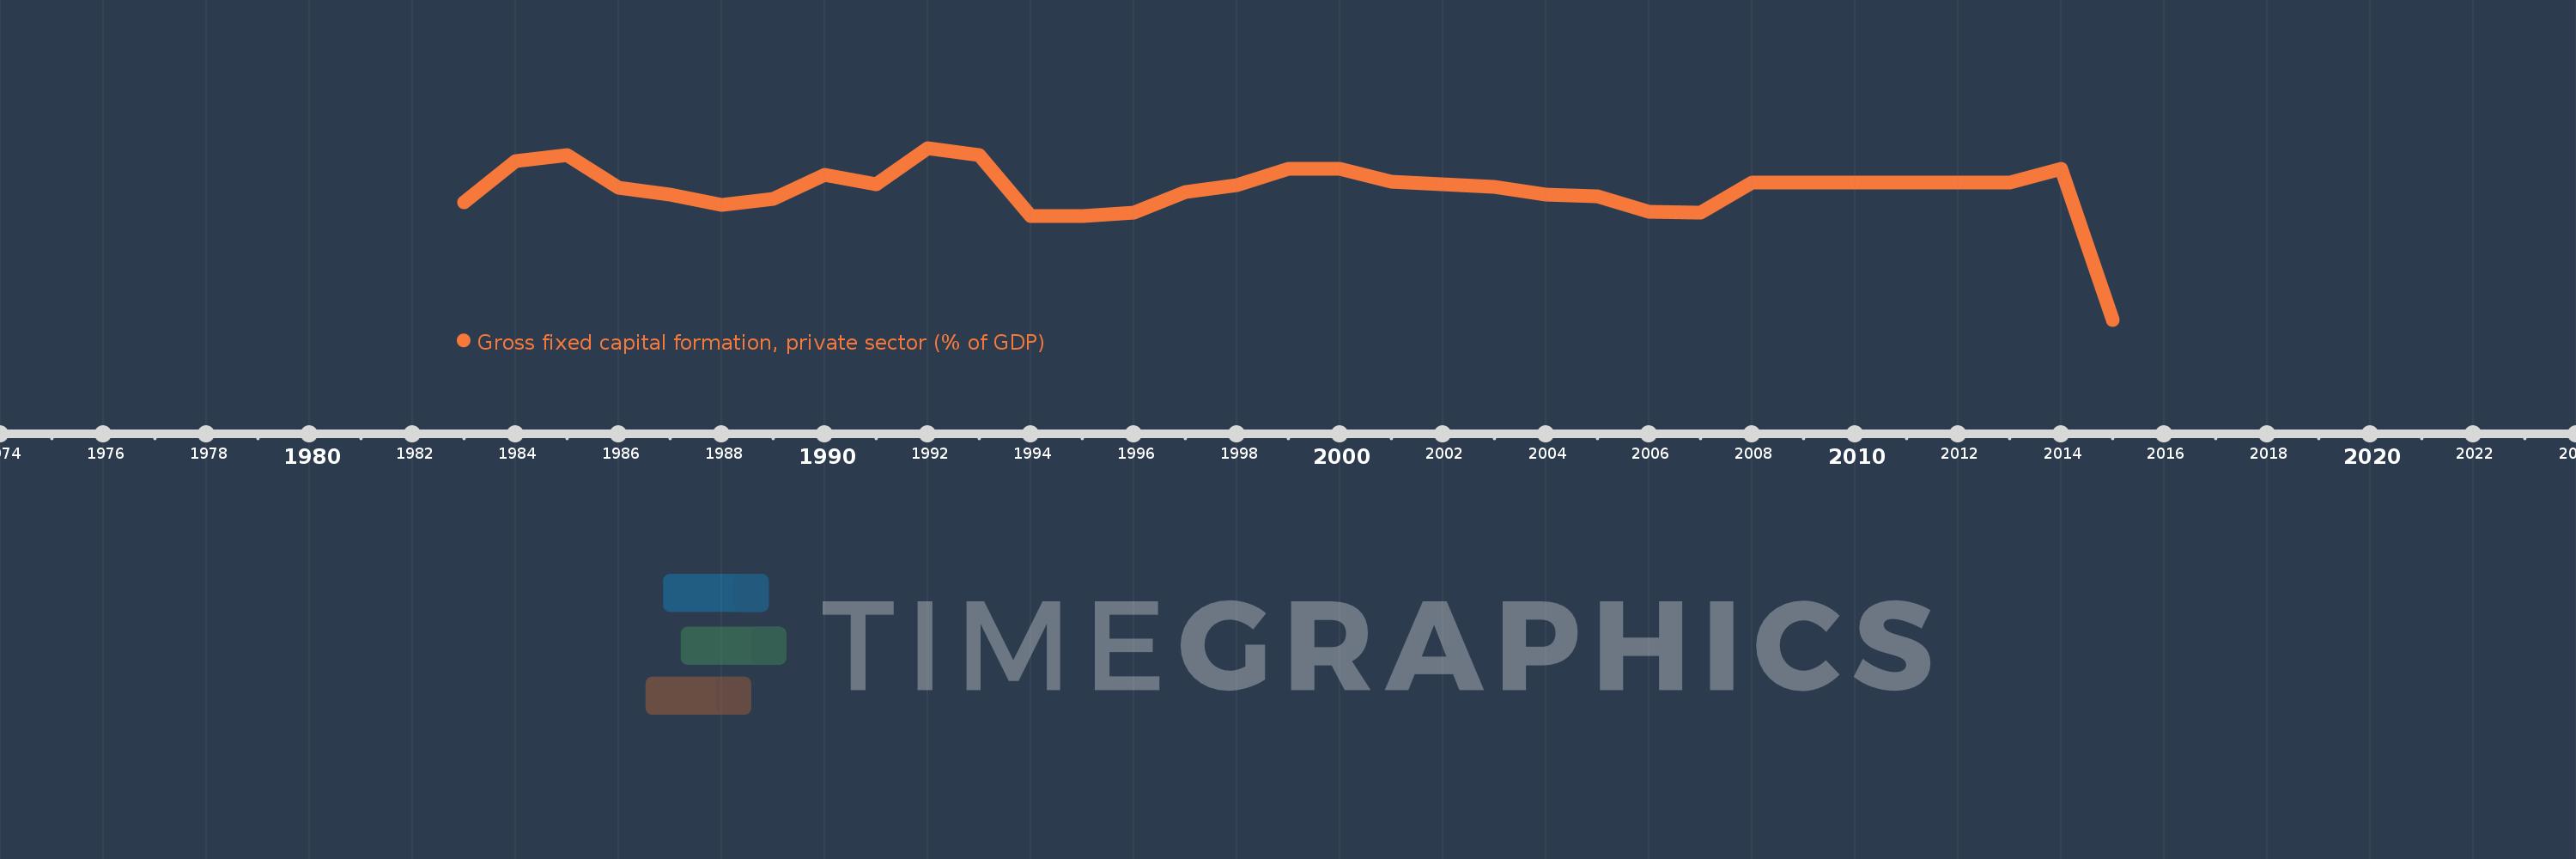
Gross fixed capital formation, private sector (% of GDP)
2015,2014,2013,2008,2007,2006,2005,2004,2003,2001,2000,1999,1998,1997,1996,1995,1994,1993,1992,1991,1990,1989,1988,1987,1986,1985,1984,1983
