29
/
en
AIzaSyAYiBZKx7MnpbEhh9jyipgxe19OcubqV5w
April 1, 2024
69636
Argentina
ARG
true
2
1
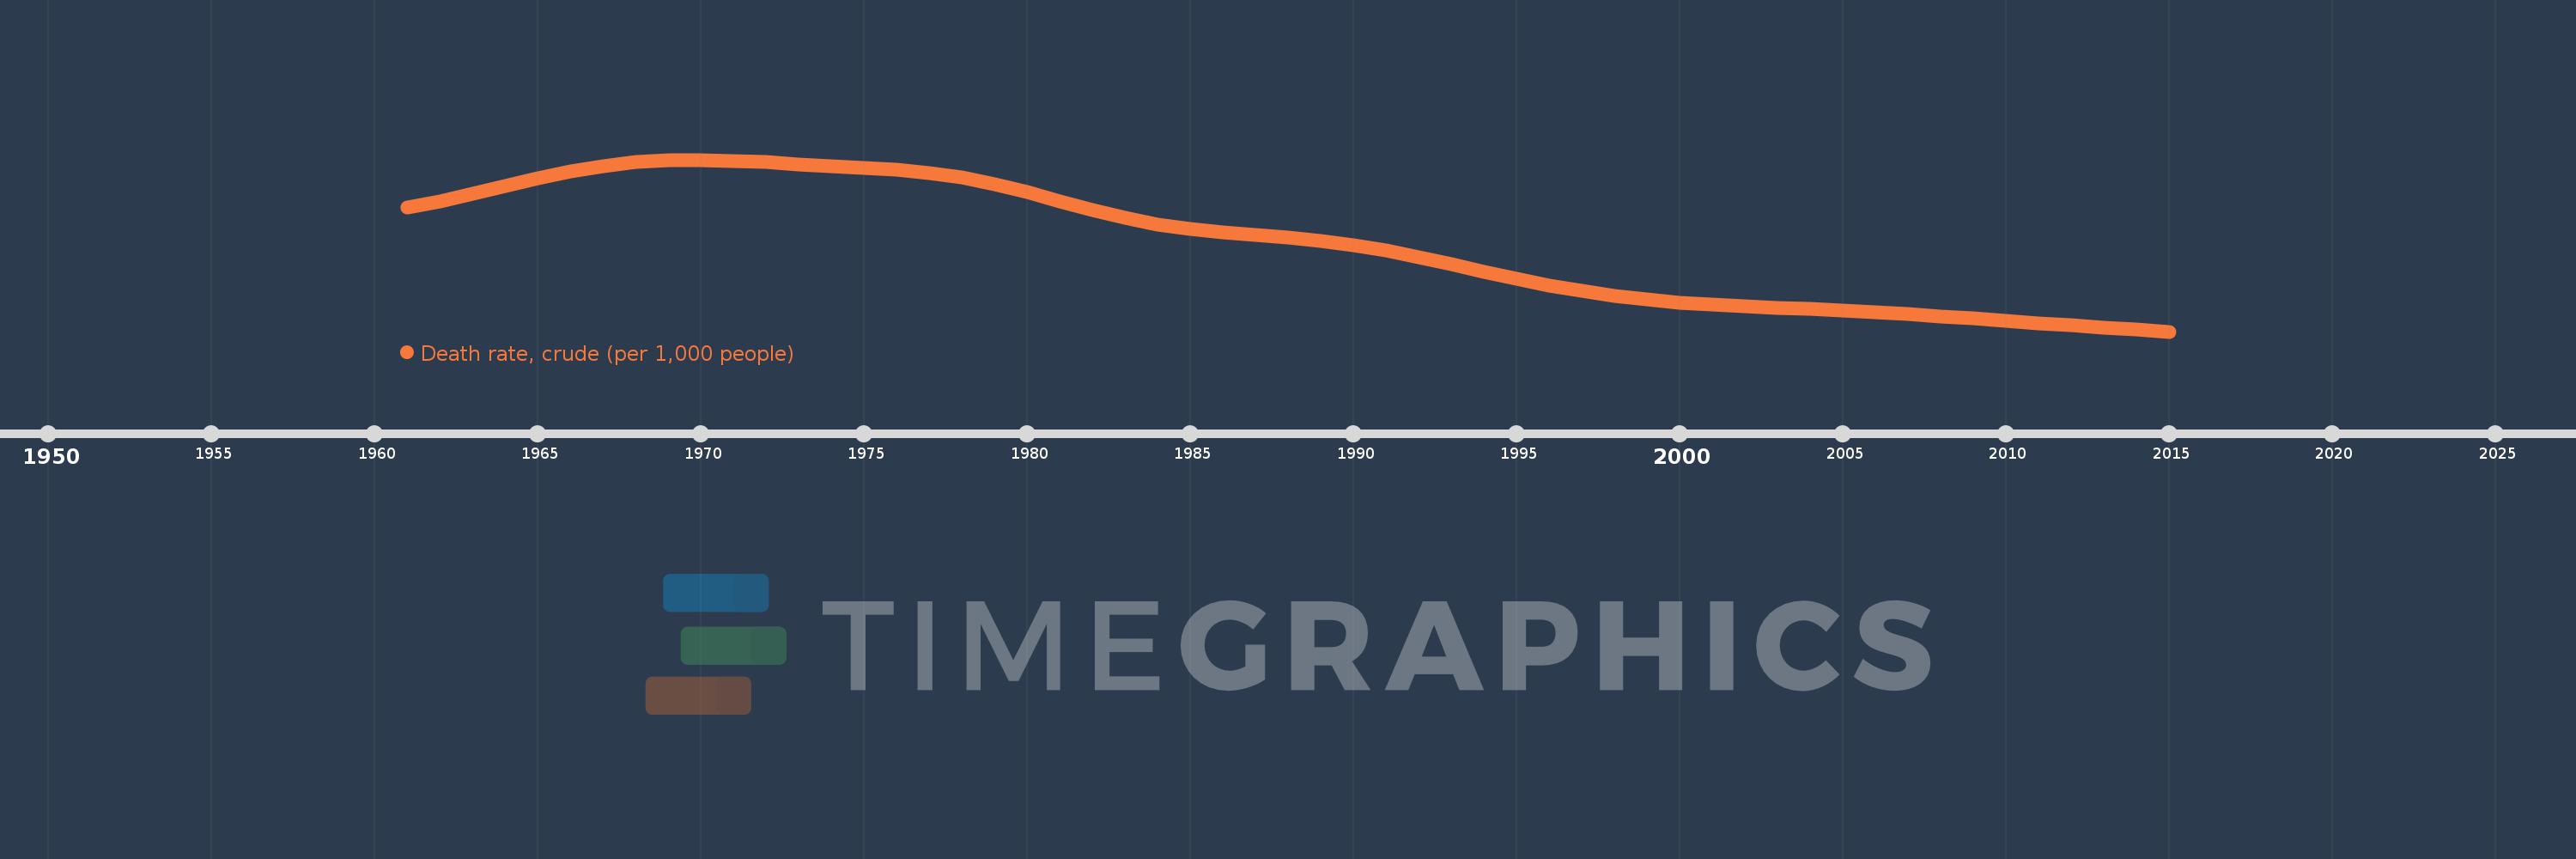
Death rate, crude (per 1,000 people)
2015,2014,2013,2012,2011,2010,2009,2008,2007,2006,2005,2004,2003,2002,2001,2000,1999,1998,1997,1996,1995,1994,1993,1992,1991,1990,1989,1988,1987,1986,1985,1984,1983,1982,1981,1980,1979,1978,1977,1976,1975,1974,1973,1972,1971,1970,1969,1968,1967,1966,1965,1964,1963,1962,1961
This statistics in other country:
AfghanistanAlbaniaAlgeriaAmerican SamoaAndorraAngolaAntigua and BarbudaArab WorldArgentinaArmeniaArubaAustraliaAustriaAzerbaijanBahamas, TheBahrainBangladeshBarbadosBelarusBelgiumBelizeBeninBermudaBhutanBoliviaBosnia and HerzegovinaBotswanaBrazilBrunei DarussalamBulgariaBurkina FasoBurundiCabo VerdeCambodiaCameroonCanadaCaribbean small statesCayman IslandsCentral African RepublicCentral Europe and the BalticsChadChannel IslandsChileChinaColombiaComorosCongo, Dem. Rep.Congo, Rep.Costa RicaCote d'IvoireCroatiaCubaCuracaoCyprusCzech RepublicDenmarkDjiboutiDominicaDominican RepublicEarly-demographic dividendEast Asia & PacificEast Asia & Pacific (excluding high income)East Asia & Pacific (IDA & IBRD countries)EcuadorEgypt, Arab Rep.El SalvadorEquatorial GuineaEritreaEstoniaEthiopiaEuro areaEurope & Central AsiaEurope & Central Asia (excluding high income)Europe & Central Asia (IDA & IBRD countries)European UnionFaroe IslandsFijiFinlandFragile and conflict affected situationsFranceFrench PolynesiaGabonGambia, TheGeorgiaGermanyGhanaGreeceGreenlandGrenadaGuamGuatemalaGuineaGuinea-BissauGuyanaHaitiHeavily indebted poor countries (HIPC)High incomeHondurasHong Kong SAR, ChinaHungaryIBRD onlyIcelandIDA & IBRD totalIDA blendIDA onlyIDA totalIndiaIndonesiaIran, Islamic Rep.IraqIrelandIsle of ManIsraelItalyJamaicaJapanJordanKazakhstanKenyaKiribatiKorea, Dem. People’s Rep.Korea, Rep.KosovoKuwaitKyrgyz RepublicLao PDRLate-demographic dividendLatin America & Caribbean Latin America & Caribbean (excluding high income)Latin America & the Caribbean (IDA & IBRD countries)LatviaLeast developed countries: UN classificationLebanonLesothoLiberiaLibyaLiechtensteinLithuaniaLow & middle incomeLow incomeLower middle incomeLuxembourgMacao SAR, ChinaMacedonia, FYRMadagascarMalawiMalaysiaMaldivesMaliMaltaMarshall IslandsMauritaniaMauritiusMexicoMicronesia, Fed. Sts.Middle East & North AfricaMiddle East & North Africa (excluding high income)Middle East & North Africa (IDA & IBRD countries)Middle incomeMoldovaMonacoMongoliaMontenegroMoroccoMozambiqueMyanmarNamibiaNepalNetherlandsNew CaledoniaNew ZealandNicaraguaNigerNigeriaNorth AmericaNorwayOECD membersOmanOther small statesPacific island small statesPakistanPalauPanamaPapua New GuineaParaguayPeruPhilippinesPolandPortugalPost-demographic dividendPre-demographic dividendPuerto RicoQatarRomaniaRussian FederationRwandaSamoaSan MarinoSao Tome and PrincipeSaudi ArabiaSenegalSerbiaSeychellesSierra LeoneSingaporeSint Maarten (Dutch part)Slovak RepublicSloveniaSmall statesSolomon IslandsSomaliaSouth AfricaSouth AsiaSouth Asia (IDA & IBRD)South SudanSpainSri LankaSt. Kitts and NevisSt. LuciaSt. Martin (French part)St. Vincent and the GrenadinesSub-Saharan Africa Sub-Saharan Africa (excluding high income)Sub-Saharan Africa (IDA & IBRD countries)SudanSurinameSwazilandSwedenSwitzerlandSyrian Arab RepublicTajikistanTanzaniaThailandTimor-LesteTogoTongaTrinidad and TobagoTunisiaTurkeyTurkmenistanUgandaUkraineUnited Arab EmiratesUnited KingdomUnited StatesUpper middle incomeUruguayUzbekistanVanuatuVenezuela, RBVietnamVirgin Islands (U.S.)West Bank and GazaWorldYemen, Rep.ZambiaZimbabwe Timeline:
This timeline shows a graph from 1961 to 2015 of Argentina. No data until 1960. Number of actual observations by date: 55.
Source name:
World Development Indicators
Source organization:
(1) United Nations Population Division. World Population Prospects, (2) Census reports and other statistical publications from national statistical offices, (3) Eurostat: Demographic Statistics, (4) United Nations Statistical Division. Population and Vital Statistics Reprot (various years), (5) U.S. Census Bureau: International Database, and (6) Secretariat of the Pacific Community: Statistics and Demography Programme.
Categories, topics:
Health
Last updated:
apr 23, 2017
Indicators value changes by year
At the date of observation
Value
Absolute change
Change from previous value
jan 1, 1961
8.637
+8.637
0.0%
jan 1, 1962
8.689
+0.052
0.6%
jan 1, 1963
8.752
+0.063
0.73%
jan 1, 1964
8.821
+0.069
0.79%
jan 1, 1965
8.889
+0.068
0.77%
jan 1, 1966
8.948
+0.059
0.66%
jan 1, 1967
8.994
+0.046
0.51%
jan 1, 1968
9.025
+0.031
0.34%
jan 1, 1969
9.043
+0.018
0.2%
jan 1, 1970
9.047
+0.004
0.04%
jan 1, 1971
9.039
-0.008
-0.09%
jan 1, 1972
9.025
-0.014
-0.15%
jan 1, 1973
9.008
-0.017
-0.19%
jan 1, 1974
8.993
-0.015
-0.17%
jan 1, 1975
8.979
-0.014
-0.16%
jan 1, 1976
8.961
-0.018
-0.2%
jan 1, 1977
8.934
-0.027
-0.3%
jan 1, 1978
8.893
-0.041
-0.46%
jan 1, 1979
8.837
-0.056
-0.63%
jan 1, 1980
8.767
-0.07
-0.79%
jan 1, 1981
8.69
-0.077
-0.88%
jan 1, 1982
8.613
-0.077
-0.89%
jan 1, 1983
8.545
-0.068
-0.79%
jan 1, 1984
8.491
-0.054
-0.63%
jan 1, 1985
8.451
-0.04
-0.47%
jan 1, 1986
8.423
-0.028
-0.33%
jan 1, 1987
8.401
-0.022
-0.26%
jan 1, 1988
8.379
-0.022
-0.26%
jan 1, 1989
8.35
-0.029
-0.35%
jan 1, 1990
8.312
-0.038
-0.46%
jan 1, 1991
8.264
-0.048
-0.58%
jan 1, 1992
8.207
-0.057
-0.69%
jan 1, 1993
8.145
-0.062
-0.76%
jan 1, 1994
8.082
-0.063
-0.77%
jan 1, 1995
8.021
-0.061
-0.75%
jan 1, 1996
7.965
-0.056
-0.7%
jan 1, 1997
7.916
-0.049
-0.62%
jan 1, 1998
7.874
-0.042
-0.53%
jan 1, 1999
7.841
-0.033
-0.42%
jan 1, 2000
7.815
-0.026
-0.33%
jan 1, 2001
7.796
-0.019
-0.24%
jan 1, 2002
7.782
-0.014
-0.18%
jan 1, 2003
7.77
-0.012
-0.15%
jan 1, 2004
7.759
-0.011
-0.14%
jan 1, 2005
7.746
-0.013
-0.17%
jan 1, 2006
7.731
-0.015
-0.19%
jan 1, 2007
7.715
-0.016
-0.21%
jan 1, 2008
7.696
-0.019
-0.25%
jan 1, 2009
7.678
-0.018
-0.23%
jan 1, 2010
7.659
-0.019
-0.25%
jan 1, 2011
7.64
-0.019
-0.25%
jan 1, 2012
7.621
-0.019
-0.25%
jan 1, 2013
7.602
-0.019
-0.25%
jan 1, 2014
7.584
-0.018
-0.24%
jan 1, 2015
7.566
-0.018
-0.24%
Ranking of countries by current statistics by years


Comments: