29
/
en
AIzaSyAYiBZKx7MnpbEhh9jyipgxe19OcubqV5w
April 1, 2024
135365
Gabon
GAB
true
2
1
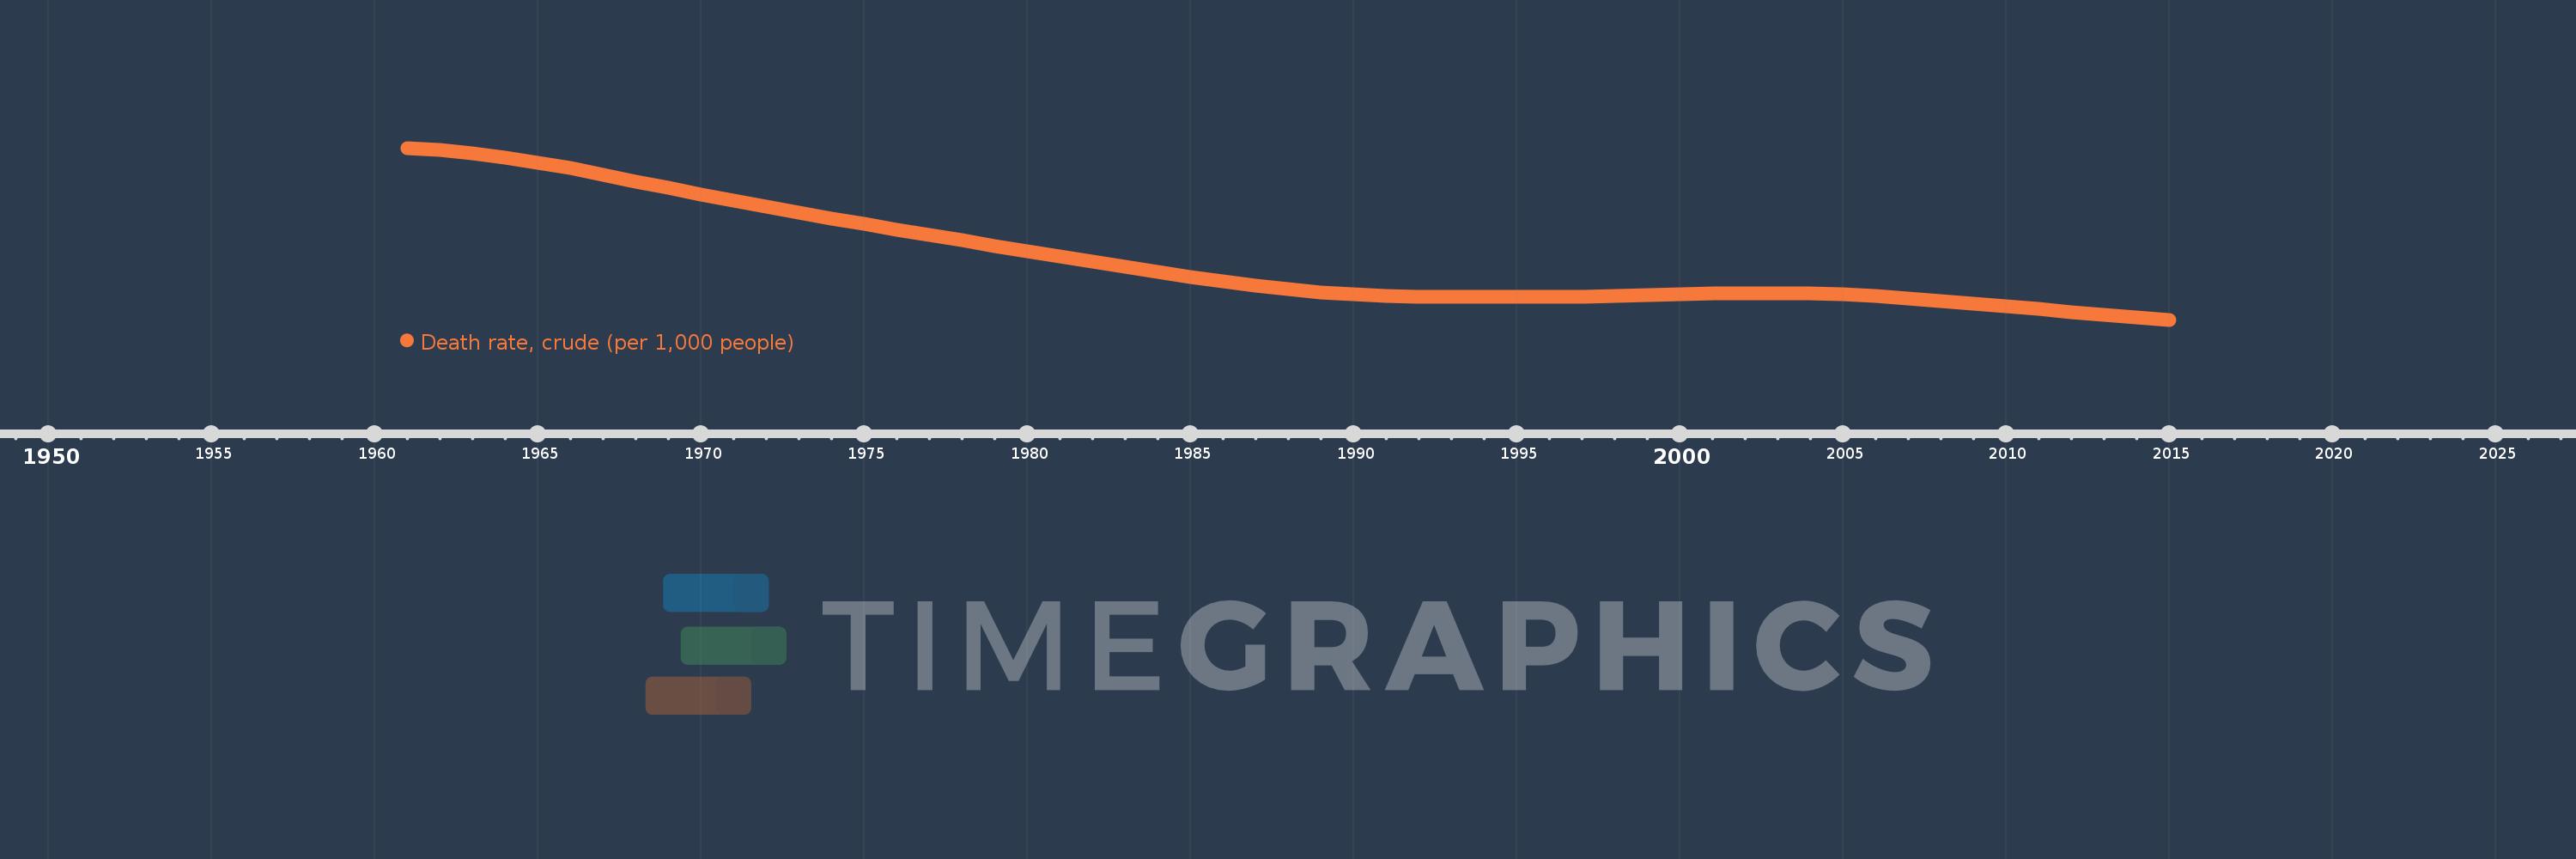
Death rate, crude (per 1,000 people)
2015,2014,2013,2012,2011,2010,2009,2008,2007,2006,2005,2004,2003,2002,2001,2000,1999,1998,1997,1996,1995,1994,1993,1992,1991,1990,1989,1988,1987,1986,1985,1984,1983,1982,1981,1980,1979,1978,1977,1976,1975,1974,1973,1972,1971,1970,1969,1968,1967,1966,1965,1964,1963,1962,1961
This statistics in other country:
AfghanistanAlbaniaAlgeriaAmerican SamoaAndorraAngolaAntigua and BarbudaArab WorldArgentinaArmeniaArubaAustraliaAustriaAzerbaijanBahamas, TheBahrainBangladeshBarbadosBelarusBelgiumBelizeBeninBermudaBhutanBoliviaBosnia and HerzegovinaBotswanaBrazilBrunei DarussalamBulgariaBurkina FasoBurundiCabo VerdeCambodiaCameroonCanadaCaribbean small statesCayman IslandsCentral African RepublicCentral Europe and the BalticsChadChannel IslandsChileChinaColombiaComorosCongo, Dem. Rep.Congo, Rep.Costa RicaCote d'IvoireCroatiaCubaCuracaoCyprusCzech RepublicDenmarkDjiboutiDominicaDominican RepublicEarly-demographic dividendEast Asia & PacificEast Asia & Pacific (excluding high income)East Asia & Pacific (IDA & IBRD countries)EcuadorEgypt, Arab Rep.El SalvadorEquatorial GuineaEritreaEstoniaEthiopiaEuro areaEurope & Central AsiaEurope & Central Asia (excluding high income)Europe & Central Asia (IDA & IBRD countries)European UnionFaroe IslandsFijiFinlandFragile and conflict affected situationsFranceFrench PolynesiaGabonGambia, TheGeorgiaGermanyGhanaGreeceGreenlandGrenadaGuamGuatemalaGuineaGuinea-BissauGuyanaHaitiHeavily indebted poor countries (HIPC)High incomeHondurasHong Kong SAR, ChinaHungaryIBRD onlyIcelandIDA & IBRD totalIDA blendIDA onlyIDA totalIndiaIndonesiaIran, Islamic Rep.IraqIrelandIsle of ManIsraelItalyJamaicaJapanJordanKazakhstanKenyaKiribatiKorea, Dem. People’s Rep.Korea, Rep.KosovoKuwaitKyrgyz RepublicLao PDRLate-demographic dividendLatin America & Caribbean Latin America & Caribbean (excluding high income)Latin America & the Caribbean (IDA & IBRD countries)LatviaLeast developed countries: UN classificationLebanonLesothoLiberiaLibyaLiechtensteinLithuaniaLow & middle incomeLow incomeLower middle incomeLuxembourgMacao SAR, ChinaMacedonia, FYRMadagascarMalawiMalaysiaMaldivesMaliMaltaMarshall IslandsMauritaniaMauritiusMexicoMicronesia, Fed. Sts.Middle East & North AfricaMiddle East & North Africa (excluding high income)Middle East & North Africa (IDA & IBRD countries)Middle incomeMoldovaMonacoMongoliaMontenegroMoroccoMozambiqueMyanmarNamibiaNepalNetherlandsNew CaledoniaNew ZealandNicaraguaNigerNigeriaNorth AmericaNorwayOECD membersOmanOther small statesPacific island small statesPakistanPalauPanamaPapua New GuineaParaguayPeruPhilippinesPolandPortugalPost-demographic dividendPre-demographic dividendPuerto RicoQatarRomaniaRussian FederationRwandaSamoaSan MarinoSao Tome and PrincipeSaudi ArabiaSenegalSerbiaSeychellesSierra LeoneSingaporeSint Maarten (Dutch part)Slovak RepublicSloveniaSmall statesSolomon IslandsSomaliaSouth AfricaSouth AsiaSouth Asia (IDA & IBRD)South SudanSpainSri LankaSt. Kitts and NevisSt. LuciaSt. Martin (French part)St. Vincent and the GrenadinesSub-Saharan Africa Sub-Saharan Africa (excluding high income)Sub-Saharan Africa (IDA & IBRD countries)SudanSurinameSwazilandSwedenSwitzerlandSyrian Arab RepublicTajikistanTanzaniaThailandTimor-LesteTogoTongaTrinidad and TobagoTunisiaTurkeyTurkmenistanUgandaUkraineUnited Arab EmiratesUnited KingdomUnited StatesUpper middle incomeUruguayUzbekistanVanuatuVenezuela, RBVietnamVirgin Islands (U.S.)West Bank and GazaWorldYemen, Rep.ZambiaZimbabwe Timeline:
This timeline shows a graph from 1961 to 2015 of Gabon. No data until 1960. Number of actual observations by date: 55.
Source name:
World Development Indicators
Source organization:
(1) United Nations Population Division. World Population Prospects, (2) Census reports and other statistical publications from national statistical offices, (3) Eurostat: Demographic Statistics, (4) United Nations Statistical Division. Population and Vital Statistics Reprot (various years), (5) U.S. Census Bureau: International Database, and (6) Secretariat of the Pacific Community: Statistics and Demography Programme.
Categories, topics:
Health
Last updated:
apr 23, 2017
Indicators value changes by year
Maximum:
25.642
jan 1, 1961
At the date of observation
Value
Absolute change
Change from previous value
jan 1, 1961
25.642
+25.642
0.0%
jan 1, 1962
25.404
-0.238
-0.93%
jan 1, 1963
25.096
-0.308
-1.21%
jan 1, 1964
24.7
-0.396
-1.58%
jan 1, 1965
24.211
-0.489
-1.98%
jan 1, 1966
23.639
-0.572
-2.36%
jan 1, 1967
23.004
-0.635
-2.69%
jan 1, 1968
22.339
-0.665
-2.89%
jan 1, 1969
21.675
-0.664
-2.97%
jan 1, 1970
21.027
-0.648
-2.99%
jan 1, 1971
20.404
-0.623
-2.96%
jan 1, 1972
19.809
-0.595
-2.92%
jan 1, 1973
19.232
-0.577
-2.91%
jan 1, 1974
18.665
-0.567
-2.95%
jan 1, 1975
18.108
-0.557
-2.98%
jan 1, 1976
17.56
-0.548
-3.03%
jan 1, 1977
17.019
-0.541
-3.08%
jan 1, 1978
16.484
-0.535
-3.14%
jan 1, 1979
15.953
-0.531
-3.22%
jan 1, 1980
15.429
-0.524
-3.28%
jan 1, 1981
14.908
-0.521
-3.38%
jan 1, 1982
14.384
-0.524
-3.51%
jan 1, 1983
13.862
-0.522
-3.63%
jan 1, 1984
13.348
-0.514
-3.71%
jan 1, 1985
12.852
-0.496
-3.72%
jan 1, 1986
12.391
-0.461
-3.59%
jan 1, 1987
11.98
-0.411
-3.32%
jan 1, 1988
11.633
-0.347
-2.9%
jan 1, 1989
11.355
-0.278
-2.39%
jan 1, 1990
11.147
-0.208
-1.83%
jan 1, 1991
11.005
-0.142
-1.27%
jan 1, 1992
10.921
-0.084
-0.76%
jan 1, 1993
10.877
-0.044
-0.4%
jan 1, 1994
10.858
-0.019
-0.17%
jan 1, 1995
10.857
-0.001
-0.01%
jan 1, 1996
10.871
+0.014
0.13%
jan 1, 1997
10.907
+0.036
0.33%
jan 1, 1998
10.968
+0.061
0.56%
jan 1, 1999
11.048
+0.08
0.73%
jan 1, 2000
11.137
+0.089
0.81%
jan 1, 2001
11.217
+0.08
0.72%
jan 1, 2002
11.267
+0.05
0.45%
jan 1, 2003
11.274
+0.007
0.06%
jan 1, 2004
11.228
-0.046
-0.41%
jan 1, 2005
11.124
-0.104
-0.93%
jan 1, 2006
10.963
-0.161
-1.45%
jan 1, 2007
10.751
-0.212
-1.93%
jan 1, 2008
10.503
-0.248
-2.31%
jan 1, 2009
10.236
-0.267
-2.54%
jan 1, 2010
9.96
-0.276
-2.7%
jan 1, 2011
9.682
-0.278
-2.79%
jan 1, 2012
9.408
-0.274
-2.83%
jan 1, 2013
9.139
-0.269
-2.86%
jan 1, 2014
8.877
-0.262
-2.87%
jan 1, 2015
8.626
-0.251
-2.83%
Ranking of countries by current statistics by years


Comments: