29
/
en
AIzaSyAYiBZKx7MnpbEhh9jyipgxe19OcubqV5w
April 1, 2024
230877
Rwanda
RWA
true
2
1
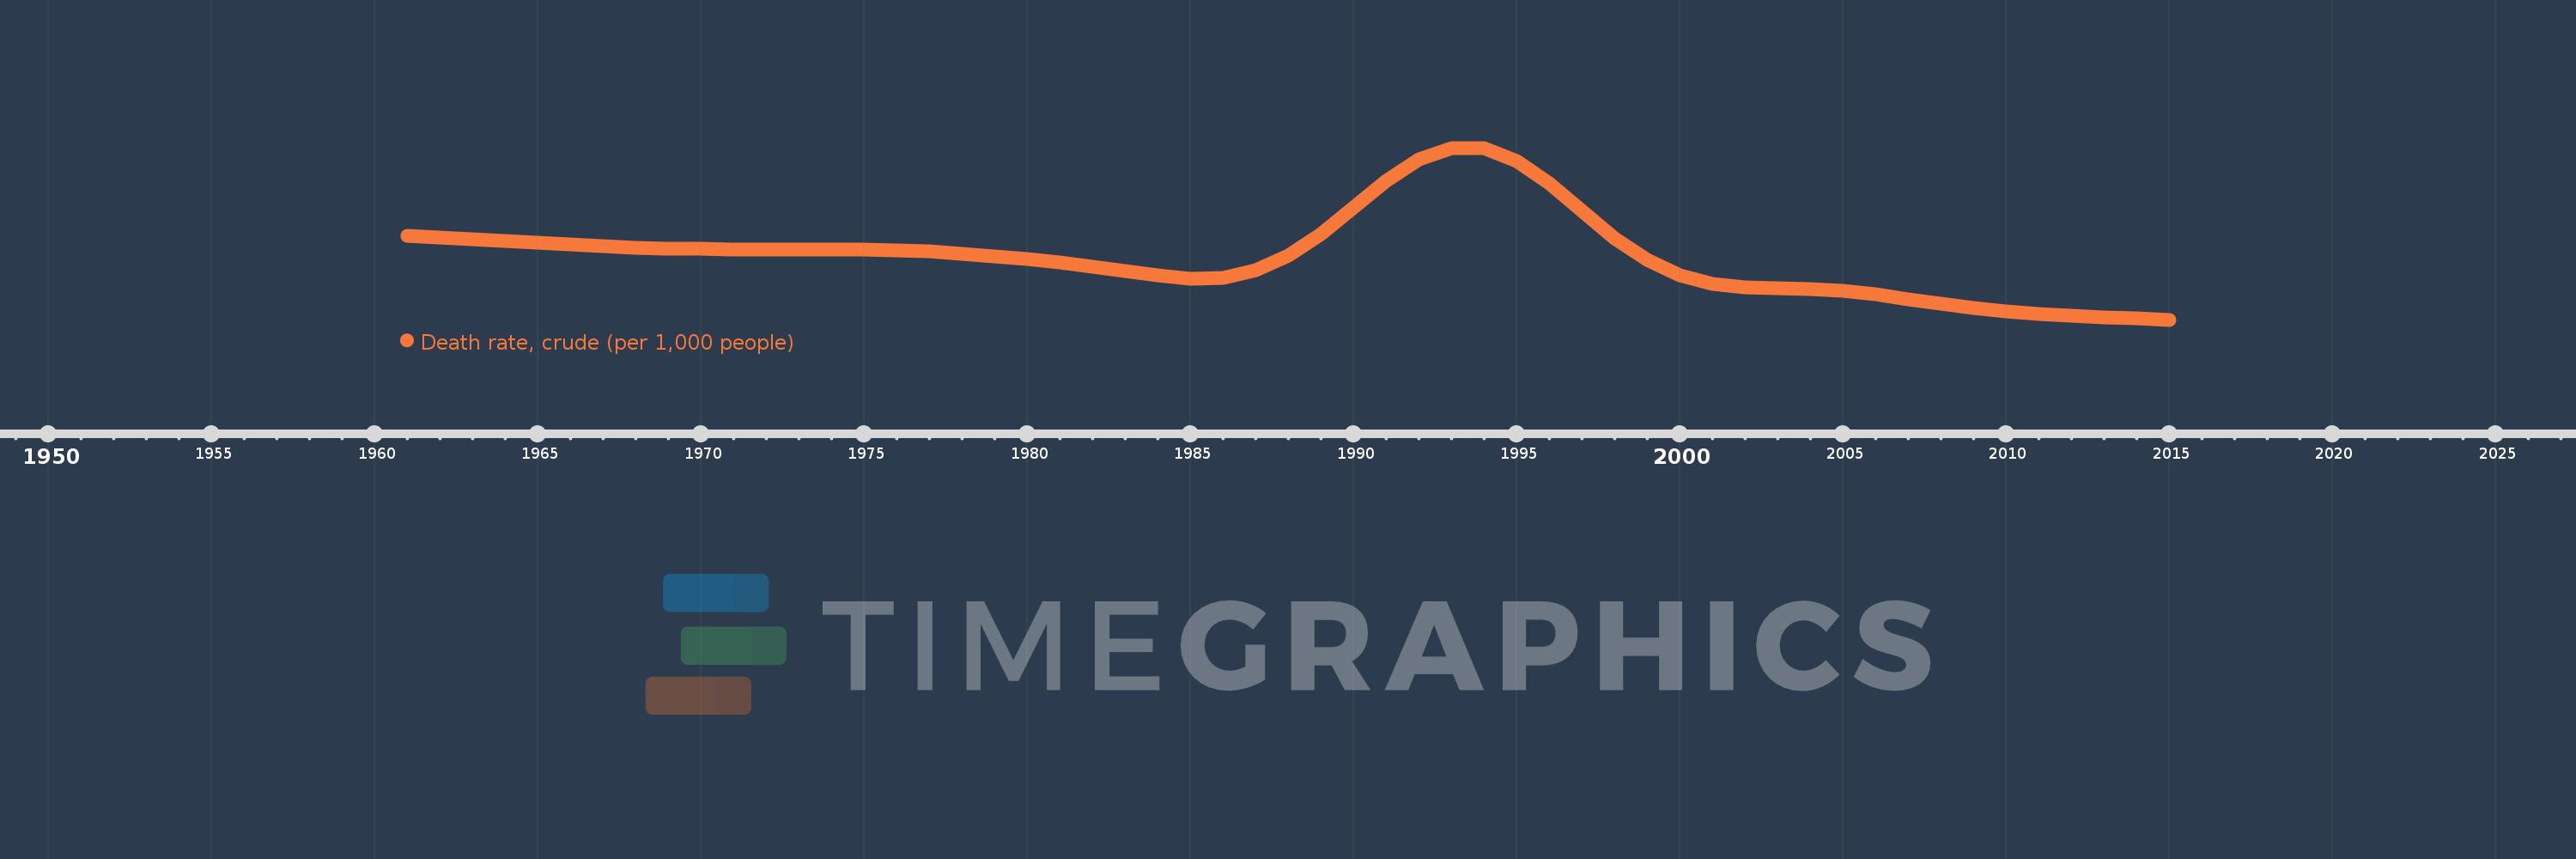
Death rate, crude (per 1,000 people)
2015,2014,2013,2012,2011,2010,2009,2008,2007,2006,2005,2004,2003,2002,2001,2000,1999,1998,1997,1996,1995,1994,1993,1992,1991,1990,1989,1988,1987,1986,1985,1984,1983,1982,1981,1980,1979,1978,1977,1976,1975,1974,1973,1972,1971,1970,1969,1968,1967,1966,1965,1964,1963,1962,1961
This statistics in other country:
AfghanistanAlbaniaAlgeriaAmerican SamoaAndorraAngolaAntigua and BarbudaArab WorldArgentinaArmeniaArubaAustraliaAustriaAzerbaijanBahamas, TheBahrainBangladeshBarbadosBelarusBelgiumBelizeBeninBermudaBhutanBoliviaBosnia and HerzegovinaBotswanaBrazilBrunei DarussalamBulgariaBurkina FasoBurundiCabo VerdeCambodiaCameroonCanadaCaribbean small statesCayman IslandsCentral African RepublicCentral Europe and the BalticsChadChannel IslandsChileChinaColombiaComorosCongo, Dem. Rep.Congo, Rep.Costa RicaCote d'IvoireCroatiaCubaCuracaoCyprusCzech RepublicDenmarkDjiboutiDominicaDominican RepublicEarly-demographic dividendEast Asia & PacificEast Asia & Pacific (excluding high income)East Asia & Pacific (IDA & IBRD countries)EcuadorEgypt, Arab Rep.El SalvadorEquatorial GuineaEritreaEstoniaEthiopiaEuro areaEurope & Central AsiaEurope & Central Asia (excluding high income)Europe & Central Asia (IDA & IBRD countries)European UnionFaroe IslandsFijiFinlandFragile and conflict affected situationsFranceFrench PolynesiaGabonGambia, TheGeorgiaGermanyGhanaGreeceGreenlandGrenadaGuamGuatemalaGuineaGuinea-BissauGuyanaHaitiHeavily indebted poor countries (HIPC)High incomeHondurasHong Kong SAR, ChinaHungaryIBRD onlyIcelandIDA & IBRD totalIDA blendIDA onlyIDA totalIndiaIndonesiaIran, Islamic Rep.IraqIrelandIsle of ManIsraelItalyJamaicaJapanJordanKazakhstanKenyaKiribatiKorea, Dem. People’s Rep.Korea, Rep.KosovoKuwaitKyrgyz RepublicLao PDRLate-demographic dividendLatin America & Caribbean Latin America & Caribbean (excluding high income)Latin America & the Caribbean (IDA & IBRD countries)LatviaLeast developed countries: UN classificationLebanonLesothoLiberiaLibyaLiechtensteinLithuaniaLow & middle incomeLow incomeLower middle incomeLuxembourgMacao SAR, ChinaMacedonia, FYRMadagascarMalawiMalaysiaMaldivesMaliMaltaMarshall IslandsMauritaniaMauritiusMexicoMicronesia, Fed. Sts.Middle East & North AfricaMiddle East & North Africa (excluding high income)Middle East & North Africa (IDA & IBRD countries)Middle incomeMoldovaMonacoMongoliaMontenegroMoroccoMozambiqueMyanmarNamibiaNepalNetherlandsNew CaledoniaNew ZealandNicaraguaNigerNigeriaNorth AmericaNorwayOECD membersOmanOther small statesPacific island small statesPakistanPalauPanamaPapua New GuineaParaguayPeruPhilippinesPolandPortugalPost-demographic dividendPre-demographic dividendPuerto RicoQatarRomaniaRussian FederationRwandaSamoaSan MarinoSao Tome and PrincipeSaudi ArabiaSenegalSerbiaSeychellesSierra LeoneSingaporeSint Maarten (Dutch part)Slovak RepublicSloveniaSmall statesSolomon IslandsSomaliaSouth AfricaSouth AsiaSouth Asia (IDA & IBRD)South SudanSpainSri LankaSt. Kitts and NevisSt. LuciaSt. Martin (French part)St. Vincent and the GrenadinesSub-Saharan Africa Sub-Saharan Africa (excluding high income)Sub-Saharan Africa (IDA & IBRD countries)SudanSurinameSwazilandSwedenSwitzerlandSyrian Arab RepublicTajikistanTanzaniaThailandTimor-LesteTogoTongaTrinidad and TobagoTunisiaTurkeyTurkmenistanUgandaUkraineUnited Arab EmiratesUnited KingdomUnited StatesUpper middle incomeUruguayUzbekistanVanuatuVenezuela, RBVietnamVirgin Islands (U.S.)West Bank and GazaWorldYemen, Rep.ZambiaZimbabwe Timeline:
This timeline shows a graph from 1961 to 2015 of Rwanda. No data until 1960. Number of actual observations by date: 55.
Source name:
World Development Indicators
Source organization:
(1) United Nations Population Division. World Population Prospects, (2) Census reports and other statistical publications from national statistical offices, (3) Eurostat: Demographic Statistics, (4) United Nations Statistical Division. Population and Vital Statistics Reprot (various years), (5) U.S. Census Bureau: International Database, and (6) Secretariat of the Pacific Community: Statistics and Demography Programme.
Categories, topics:
Health
Last updated:
apr 23, 2017
Indicators value changes by year
Maximum:
39.597
jan 1, 1993
At the date of observation
Value
Absolute change
Change from previous value
jan 1, 1961
22.98
+22.98
0.0%
jan 1, 1962
22.652
-0.328
-1.43%
jan 1, 1963
22.307
-0.345
-1.52%
jan 1, 1964
21.953
-0.354
-1.59%
jan 1, 1965
21.599
-0.354
-1.61%
jan 1, 1966
21.264
-0.335
-1.55%
jan 1, 1967
20.972
-0.292
-1.37%
jan 1, 1968
20.735
-0.237
-1.13%
jan 1, 1969
20.557
-0.178
-0.86%
jan 1, 1970
20.438
-0.119
-0.58%
jan 1, 1971
20.372
-0.066
-0.32%
jan 1, 1972
20.35
-0.022
-0.11%
jan 1, 1973
20.348
-0.002
-0.01%
jan 1, 1974
20.337
-0.011
-0.05%
jan 1, 1975
20.295
-0.042
-0.21%
jan 1, 1976
20.179
-0.116
-0.57%
jan 1, 1977
19.946
-0.233
-1.15%
jan 1, 1978
19.591
-0.355
-1.78%
jan 1, 1979
19.126
-0.465
-2.37%
jan 1, 1980
18.582
-0.544
-2.84%
jan 1, 1981
17.929
-0.653
-3.51%
jan 1, 1982
17.129
-0.8
-4.46%
jan 1, 1983
16.25
-0.879
-5.13%
jan 1, 1984
15.434
-0.816
-5.02%
jan 1, 1985
14.859
-0.575
-3.73%
jan 1, 1986
15.0
+0.141
0.95%
jan 1, 1987
16.408
+1.408
9.39%
jan 1, 1988
19.236
+2.828
17.24%
jan 1, 1989
23.342
+4.106
21.35%
jan 1, 1990
28.353
+5.011
21.47%
jan 1, 1991
33.409
+5.056
17.83%
jan 1, 1992
37.428
+4.019
12.03%
jan 1, 1993
39.597
+2.169
5.8%
jan 1, 1994
39.476
-0.121
-0.31%
jan 1, 1995
37.065
-2.411
-6.11%
jan 1, 1996
32.83
-4.235
-11.43%
jan 1, 1997
27.616
-5.214
-15.88%
jan 1, 1998
22.503
-5.113
-18.51%
jan 1, 1999
18.325
-4.178
-18.57%
jan 1, 2000
15.411
-2.914
-15.9%
jan 1, 2001
13.806
-1.605
-10.41%
jan 1, 2002
13.24
-0.566
-4.1%
jan 1, 2003
13.099
-0.141
-1.06%
jan 1, 2004
12.897
-0.202
-1.54%
jan 1, 2005
12.488
-0.409
-3.17%
jan 1, 2006
11.82
-0.668
-5.35%
jan 1, 2007
10.952
-0.868
-7.34%
jan 1, 2008
10.064
-0.888
-8.11%
jan 1, 2009
9.294
-0.77
-7.65%
jan 1, 2010
8.664
-0.63
-6.78%
jan 1, 2011
8.179
-0.485
-5.6%
jan 1, 2012
7.817
-0.362
-4.43%
jan 1, 2013
7.532
-0.285
-3.65%
jan 1, 2014
7.283
-0.249
-3.31%
jan 1, 2015
7.053
-0.23
-3.16%
Ranking of countries by current statistics by years


Comments: