29
/
en
AIzaSyAYiBZKx7MnpbEhh9jyipgxe19OcubqV5w
April 1, 2024
34141
Fragile and conflict affected situations
FCS
false
2
1
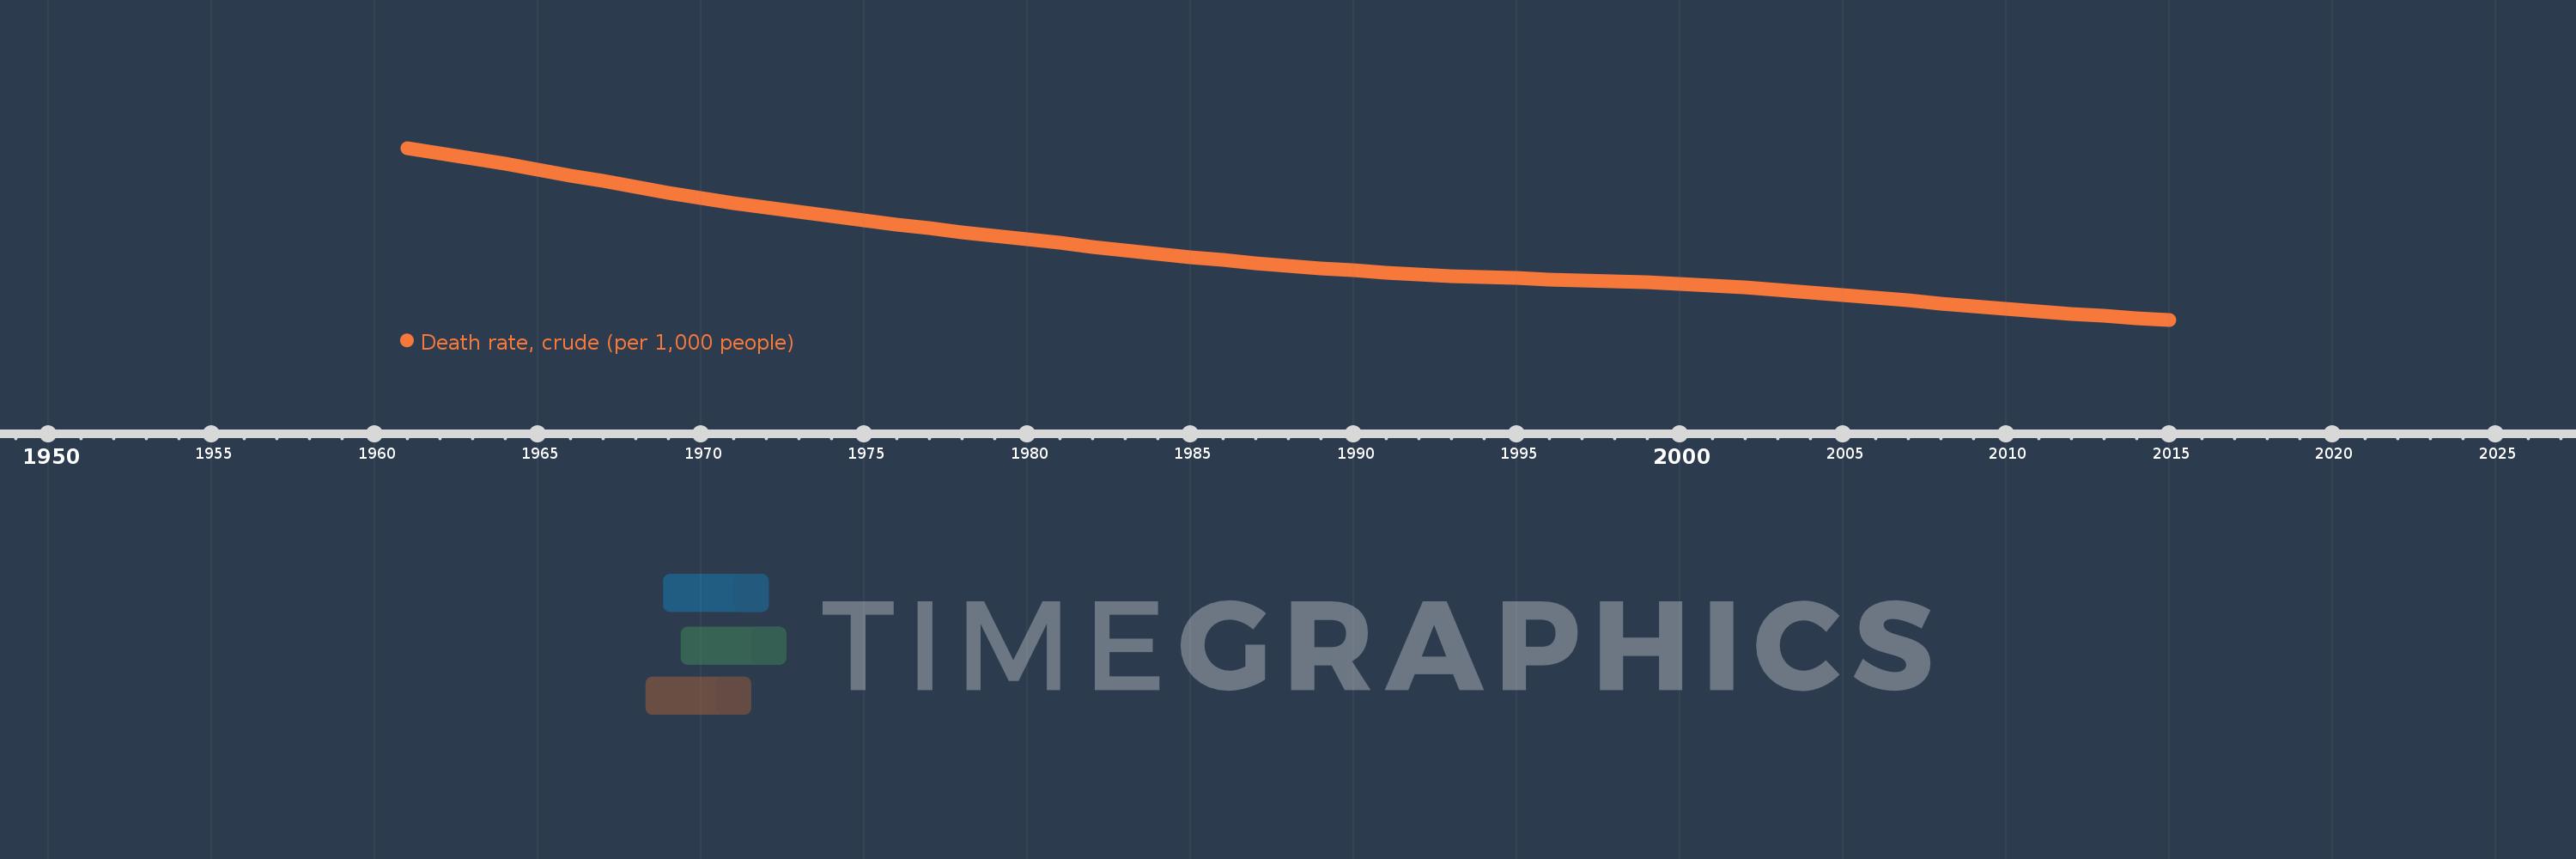
Death rate, crude (per 1,000 people)
2015,2014,2013,2012,2011,2010,2009,2008,2007,2006,2005,2004,2003,2002,2001,2000,1999,1998,1997,1996,1995,1994,1993,1992,1991,1990,1989,1988,1987,1986,1985,1984,1983,1982,1981,1980,1979,1978,1977,1976,1975,1974,1973,1972,1971,1970,1969,1968,1967,1966,1965,1964,1963,1962,1961
This statistics in other country:
AfghanistanAlbaniaAlgeriaAmerican SamoaAndorraAngolaAntigua and BarbudaArab WorldArgentinaArmeniaArubaAustraliaAustriaAzerbaijanBahamas, TheBahrainBangladeshBarbadosBelarusBelgiumBelizeBeninBermudaBhutanBoliviaBosnia and HerzegovinaBotswanaBrazilBrunei DarussalamBulgariaBurkina FasoBurundiCabo VerdeCambodiaCameroonCanadaCaribbean small statesCayman IslandsCentral African RepublicCentral Europe and the BalticsChadChannel IslandsChileChinaColombiaComorosCongo, Dem. Rep.Congo, Rep.Costa RicaCote d'IvoireCroatiaCubaCuracaoCyprusCzech RepublicDenmarkDjiboutiDominicaDominican RepublicEarly-demographic dividendEast Asia & PacificEast Asia & Pacific (excluding high income)East Asia & Pacific (IDA & IBRD countries)EcuadorEgypt, Arab Rep.El SalvadorEquatorial GuineaEritreaEstoniaEthiopiaEuro areaEurope & Central AsiaEurope & Central Asia (excluding high income)Europe & Central Asia (IDA & IBRD countries)European UnionFaroe IslandsFijiFinlandFragile and conflict affected situationsFranceFrench PolynesiaGabonGambia, TheGeorgiaGermanyGhanaGreeceGreenlandGrenadaGuamGuatemalaGuineaGuinea-BissauGuyanaHaitiHeavily indebted poor countries (HIPC)High incomeHondurasHong Kong SAR, ChinaHungaryIBRD onlyIcelandIDA & IBRD totalIDA blendIDA onlyIDA totalIndiaIndonesiaIran, Islamic Rep.IraqIrelandIsle of ManIsraelItalyJamaicaJapanJordanKazakhstanKenyaKiribatiKorea, Dem. People’s Rep.Korea, Rep.KosovoKuwaitKyrgyz RepublicLao PDRLate-demographic dividendLatin America & Caribbean Latin America & Caribbean (excluding high income)Latin America & the Caribbean (IDA & IBRD countries)LatviaLeast developed countries: UN classificationLebanonLesothoLiberiaLibyaLiechtensteinLithuaniaLow & middle incomeLow incomeLower middle incomeLuxembourgMacao SAR, ChinaMacedonia, FYRMadagascarMalawiMalaysiaMaldivesMaliMaltaMarshall IslandsMauritaniaMauritiusMexicoMicronesia, Fed. Sts.Middle East & North AfricaMiddle East & North Africa (excluding high income)Middle East & North Africa (IDA & IBRD countries)Middle incomeMoldovaMonacoMongoliaMontenegroMoroccoMozambiqueMyanmarNamibiaNepalNetherlandsNew CaledoniaNew ZealandNicaraguaNigerNigeriaNorth AmericaNorwayOECD membersOmanOther small statesPacific island small statesPakistanPalauPanamaPapua New GuineaParaguayPeruPhilippinesPolandPortugalPost-demographic dividendPre-demographic dividendPuerto RicoQatarRomaniaRussian FederationRwandaSamoaSan MarinoSao Tome and PrincipeSaudi ArabiaSenegalSerbiaSeychellesSierra LeoneSingaporeSint Maarten (Dutch part)Slovak RepublicSloveniaSmall statesSolomon IslandsSomaliaSouth AfricaSouth AsiaSouth Asia (IDA & IBRD)South SudanSpainSri LankaSt. Kitts and NevisSt. LuciaSt. Martin (French part)St. Vincent and the GrenadinesSub-Saharan Africa Sub-Saharan Africa (excluding high income)Sub-Saharan Africa (IDA & IBRD countries)SudanSurinameSwazilandSwedenSwitzerlandSyrian Arab RepublicTajikistanTanzaniaThailandTimor-LesteTogoTongaTrinidad and TobagoTunisiaTurkeyTurkmenistanUgandaUkraineUnited Arab EmiratesUnited KingdomUnited StatesUpper middle incomeUruguayUzbekistanVanuatuVenezuela, RBVietnamVirgin Islands (U.S.)West Bank and GazaWorldYemen, Rep.ZambiaZimbabwe Timeline:
This timeline shows a graph from 1961 to 2015 of Fragile and conflict affected situations. No data until 1960. Number of actual observations by date: 55.
Source name:
World Development Indicators
Source organization:
(1) United Nations Population Division. World Population Prospects, (2) Census reports and other statistical publications from national statistical offices, (3) Eurostat: Demographic Statistics, (4) United Nations Statistical Division. Population and Vital Statistics Reprot (various years), (5) U.S. Census Bureau: International Database, and (6) Secretariat of the Pacific Community: Statistics and Demography Programme.
Categories, topics:
Health
Last updated:
apr 23, 2017
Indicators value changes by year
Maximum:
24.036
jan 1, 1961
At the date of observation
Value
Absolute change
Change from previous value
jan 1, 1961
24.036
+24.036
0.0%
jan 1, 1962
23.576
-0.46
-1.91%
jan 1, 1963
23.109
-0.467
-1.98%
jan 1, 1964
22.627
-0.483
-2.09%
jan 1, 1965
22.127
-0.5
-2.21%
jan 1, 1966
21.613
-0.514
-2.32%
jan 1, 1967
21.094
-0.519
-2.4%
jan 1, 1968
20.584
-0.511
-2.42%
jan 1, 1969
20.092
-0.492
-2.39%
jan 1, 1970
19.624
-0.468
-2.33%
jan 1, 1971
19.182
-0.442
-2.25%
jan 1, 1972
18.763
-0.419
-2.18%
jan 1, 1973
18.364
-0.399
-2.13%
jan 1, 1974
17.98
-0.384
-2.09%
jan 1, 1975
17.611
-0.368
-2.05%
jan 1, 1976
17.258
-0.353
-2.01%
jan 1, 1977
16.921
-0.337
-1.95%
jan 1, 1978
16.599
-0.322
-1.9%
jan 1, 1979
16.287
-0.312
-1.88%
jan 1, 1980
15.981
-0.307
-1.88%
jan 1, 1981
15.674
-0.307
-1.92%
jan 1, 1982
15.31
-0.363
-2.32%
jan 1, 1983
14.999
-0.311
-2.03%
jan 1, 1984
14.693
-0.306
-2.04%
jan 1, 1985
14.398
-0.296
-2.01%
jan 1, 1986
14.117
-0.28
-1.95%
jan 1, 1987
13.856
-0.261
-1.85%
jan 1, 1988
13.618
-0.239
-1.72%
jan 1, 1989
13.406
-0.211
-1.55%
jan 1, 1990
13.216
-0.19
-1.42%
jan 1, 1991
13.0
-0.216
-1.64%
jan 1, 1992
12.854
-0.146
-1.12%
jan 1, 1993
12.727
-0.127
-0.99%
jan 1, 1994
12.617
-0.111
-0.87%
jan 1, 1995
12.52
-0.097
-0.77%
jan 1, 1996
12.43
-0.09
-0.72%
jan 1, 1997
12.339
-0.091
-0.73%
jan 1, 1998
12.245
-0.095
-0.77%
jan 1, 1999
12.141
-0.104
-0.85%
jan 1, 2000
12.025
-0.116
-0.96%
jan 1, 2001
11.878
-0.146
-1.22%
jan 1, 2002
11.704
-0.174
-1.46%
jan 1, 2003
11.505
-0.199
-1.7%
jan 1, 2004
11.284
-0.221
-1.92%
jan 1, 2005
11.047
-0.237
-2.1%
jan 1, 2006
10.797
-0.25
-2.26%
jan 1, 2007
10.54
-0.257
-2.38%
jan 1, 2008
10.281
-0.258
-2.45%
jan 1, 2009
10.032
-0.249
-2.42%
jan 1, 2010
9.797
-0.235
-2.35%
jan 1, 2011
9.579
-0.218
-2.23%
jan 1, 2012
9.377
-0.202
-2.11%
jan 1, 2013
9.191
-0.186
-1.99%
jan 1, 2014
9.015
-0.176
-1.91%
jan 1, 2015
8.85
-0.165
-1.83%
Ranking of countries by current statistics by years


Comments: