29
/
en
AIzaSyAYiBZKx7MnpbEhh9jyipgxe19OcubqV5w
April 1, 2024
205109
Namibia
NAM
true
2
1
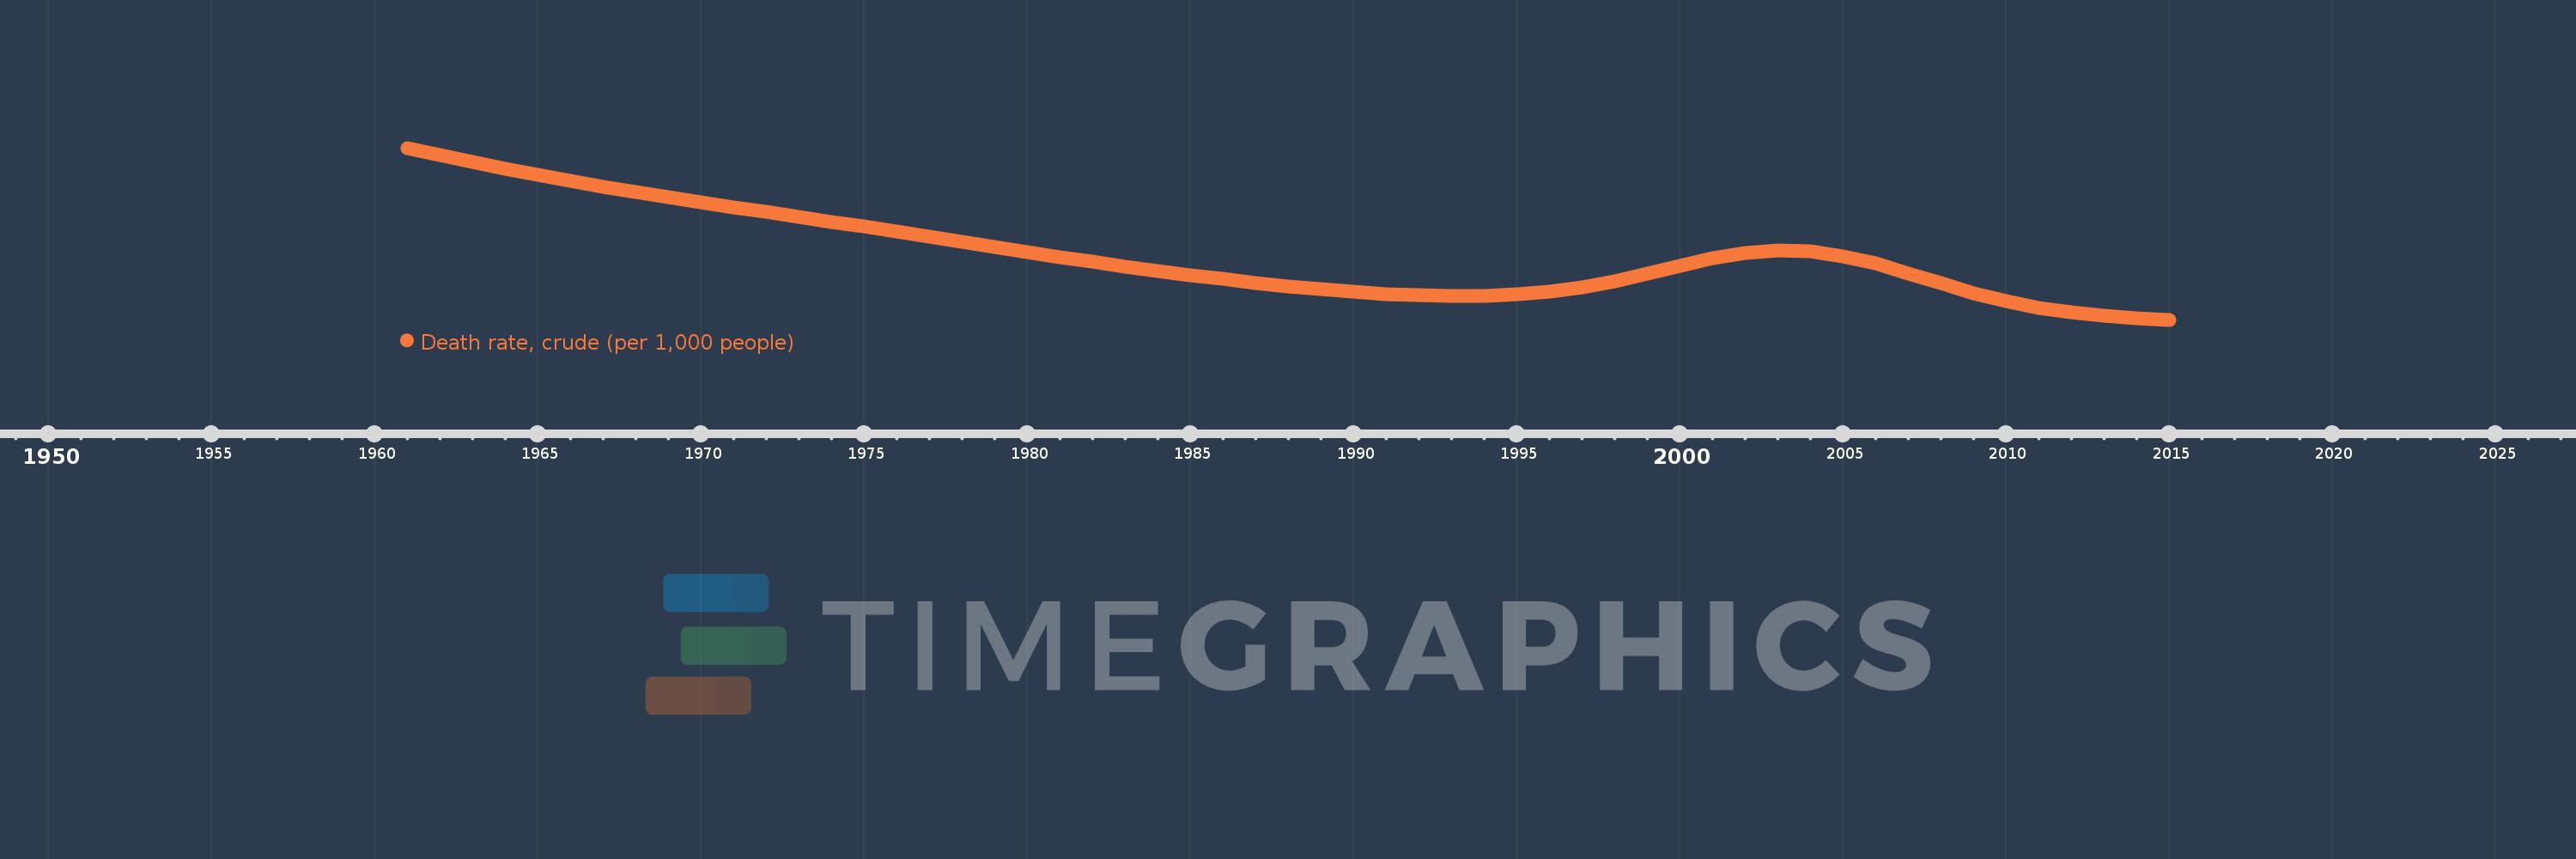
Death rate, crude (per 1,000 people)
2015,2014,2013,2012,2011,2010,2009,2008,2007,2006,2005,2004,2003,2002,2001,2000,1999,1998,1997,1996,1995,1994,1993,1992,1991,1990,1989,1988,1987,1986,1985,1984,1983,1982,1981,1980,1979,1978,1977,1976,1975,1974,1973,1972,1971,1970,1969,1968,1967,1966,1965,1964,1963,1962,1961
This statistics in other country:
AfghanistanAlbaniaAlgeriaAmerican SamoaAndorraAngolaAntigua and BarbudaArab WorldArgentinaArmeniaArubaAustraliaAustriaAzerbaijanBahamas, TheBahrainBangladeshBarbadosBelarusBelgiumBelizeBeninBermudaBhutanBoliviaBosnia and HerzegovinaBotswanaBrazilBrunei DarussalamBulgariaBurkina FasoBurundiCabo VerdeCambodiaCameroonCanadaCaribbean small statesCayman IslandsCentral African RepublicCentral Europe and the BalticsChadChannel IslandsChileChinaColombiaComorosCongo, Dem. Rep.Congo, Rep.Costa RicaCote d'IvoireCroatiaCubaCuracaoCyprusCzech RepublicDenmarkDjiboutiDominicaDominican RepublicEarly-demographic dividendEast Asia & PacificEast Asia & Pacific (excluding high income)East Asia & Pacific (IDA & IBRD countries)EcuadorEgypt, Arab Rep.El SalvadorEquatorial GuineaEritreaEstoniaEthiopiaEuro areaEurope & Central AsiaEurope & Central Asia (excluding high income)Europe & Central Asia (IDA & IBRD countries)European UnionFaroe IslandsFijiFinlandFragile and conflict affected situationsFranceFrench PolynesiaGabonGambia, TheGeorgiaGermanyGhanaGreeceGreenlandGrenadaGuamGuatemalaGuineaGuinea-BissauGuyanaHaitiHeavily indebted poor countries (HIPC)High incomeHondurasHong Kong SAR, ChinaHungaryIBRD onlyIcelandIDA & IBRD totalIDA blendIDA onlyIDA totalIndiaIndonesiaIran, Islamic Rep.IraqIrelandIsle of ManIsraelItalyJamaicaJapanJordanKazakhstanKenyaKiribatiKorea, Dem. People’s Rep.Korea, Rep.KosovoKuwaitKyrgyz RepublicLao PDRLate-demographic dividendLatin America & Caribbean Latin America & Caribbean (excluding high income)Latin America & the Caribbean (IDA & IBRD countries)LatviaLeast developed countries: UN classificationLebanonLesothoLiberiaLibyaLiechtensteinLithuaniaLow & middle incomeLow incomeLower middle incomeLuxembourgMacao SAR, ChinaMacedonia, FYRMadagascarMalawiMalaysiaMaldivesMaliMaltaMarshall IslandsMauritaniaMauritiusMexicoMicronesia, Fed. Sts.Middle East & North AfricaMiddle East & North Africa (excluding high income)Middle East & North Africa (IDA & IBRD countries)Middle incomeMoldovaMonacoMongoliaMontenegroMoroccoMozambiqueMyanmarNamibiaNepalNetherlandsNew CaledoniaNew ZealandNicaraguaNigerNigeriaNorth AmericaNorwayOECD membersOmanOther small statesPacific island small statesPakistanPalauPanamaPapua New GuineaParaguayPeruPhilippinesPolandPortugalPost-demographic dividendPre-demographic dividendPuerto RicoQatarRomaniaRussian FederationRwandaSamoaSan MarinoSao Tome and PrincipeSaudi ArabiaSenegalSerbiaSeychellesSierra LeoneSingaporeSint Maarten (Dutch part)Slovak RepublicSloveniaSmall statesSolomon IslandsSomaliaSouth AfricaSouth AsiaSouth Asia (IDA & IBRD)South SudanSpainSri LankaSt. Kitts and NevisSt. LuciaSt. Martin (French part)St. Vincent and the GrenadinesSub-Saharan Africa Sub-Saharan Africa (excluding high income)Sub-Saharan Africa (IDA & IBRD countries)SudanSurinameSwazilandSwedenSwitzerlandSyrian Arab RepublicTajikistanTanzaniaThailandTimor-LesteTogoTongaTrinidad and TobagoTunisiaTurkeyTurkmenistanUgandaUkraineUnited Arab EmiratesUnited KingdomUnited StatesUpper middle incomeUruguayUzbekistanVanuatuVenezuela, RBVietnamVirgin Islands (U.S.)West Bank and GazaWorldYemen, Rep.ZambiaZimbabwe Timeline:
This timeline shows a graph from 1961 to 2015 of Namibia. No data until 1960. Number of actual observations by date: 55.
Source name:
World Development Indicators
Source organization:
(1) United Nations Population Division. World Population Prospects, (2) Census reports and other statistical publications from national statistical offices, (3) Eurostat: Demographic Statistics, (4) United Nations Statistical Division. Population and Vital Statistics Reprot (various years), (5) U.S. Census Bureau: International Database, and (6) Secretariat of the Pacific Community: Statistics and Demography Programme.
Categories, topics:
Health
Last updated:
apr 23, 2017
Indicators value changes by year
Maximum:
18.566
jan 1, 1961
At the date of observation
Value
Absolute change
Change from previous value
jan 1, 1961
18.566
+18.566
0.0%
jan 1, 1962
18.081
-0.485
-2.61%
jan 1, 1963
17.618
-0.463
-2.56%
jan 1, 1964
17.177
-0.441
-2.5%
jan 1, 1965
16.756
-0.421
-2.45%
jan 1, 1966
16.355
-0.401
-2.39%
jan 1, 1967
15.974
-0.381
-2.33%
jan 1, 1968
15.612
-0.362
-2.27%
jan 1, 1969
15.265
-0.347
-2.22%
jan 1, 1970
14.931
-0.334
-2.19%
jan 1, 1971
14.604
-0.327
-2.19%
jan 1, 1972
14.281
-0.323
-2.21%
jan 1, 1973
13.958
-0.323
-2.26%
jan 1, 1974
13.634
-0.324
-2.32%
jan 1, 1975
13.306
-0.328
-2.41%
jan 1, 1976
12.974
-0.332
-2.5%
jan 1, 1977
12.636
-0.338
-2.61%
jan 1, 1978
12.295
-0.341
-2.7%
jan 1, 1979
11.956
-0.339
-2.76%
jan 1, 1980
11.62
-0.336
-2.81%
jan 1, 1981
11.291
-0.329
-2.83%
jan 1, 1982
10.97
-0.321
-2.84%
jan 1, 1983
10.658
-0.312
-2.84%
jan 1, 1984
10.361
-0.297
-2.79%
jan 1, 1985
10.08
-0.281
-2.71%
jan 1, 1986
9.818
-0.262
-2.6%
jan 1, 1987
9.572
-0.246
-2.51%
jan 1, 1988
9.344
-0.228
-2.38%
jan 1, 1989
9.138
-0.206
-2.2%
jan 1, 1990
8.962
-0.176
-1.93%
jan 1, 1991
8.824
-0.138
-1.54%
jan 1, 1992
8.732
-0.092
-1.04%
jan 1, 1993
8.693
-0.039
-0.45%
jan 1, 1994
8.712
+0.019
0.22%
jan 1, 1995
8.796
+0.084
0.96%
jan 1, 1996
8.971
+0.175
1.99%
jan 1, 1997
9.268
+0.297
3.31%
jan 1, 1998
9.681
+0.413
4.46%
jan 1, 1999
10.179
+0.498
5.14%
jan 1, 2000
10.719
+0.54
5.31%
jan 1, 2001
11.216
+0.497
4.64%
jan 1, 2002
11.576
+0.36
3.21%
jan 1, 2003
11.734
+0.158
1.36%
jan 1, 2004
11.659
-0.075
-0.64%
jan 1, 2005
11.352
-0.307
-2.63%
jan 1, 2006
10.845
-0.507
-4.47%
jan 1, 2007
10.202
-0.643
-5.93%
jan 1, 2008
9.519
-0.683
-6.69%
jan 1, 2009
8.88
-0.639
-6.71%
jan 1, 2010
8.328
-0.552
-6.22%
jan 1, 2011
7.893
-0.435
-5.22%
jan 1, 2012
7.582
-0.311
-3.94%
jan 1, 2013
7.363
-0.219
-2.89%
jan 1, 2014
7.205
-0.158
-2.15%
jan 1, 2015
7.099
-0.106
-1.47%
Ranking of countries by current statistics by years


Comments: