29
/
en
AIzaSyAYiBZKx7MnpbEhh9jyipgxe19OcubqV5w
April 1, 2024
235578
Senegal
SEN
true
2
1
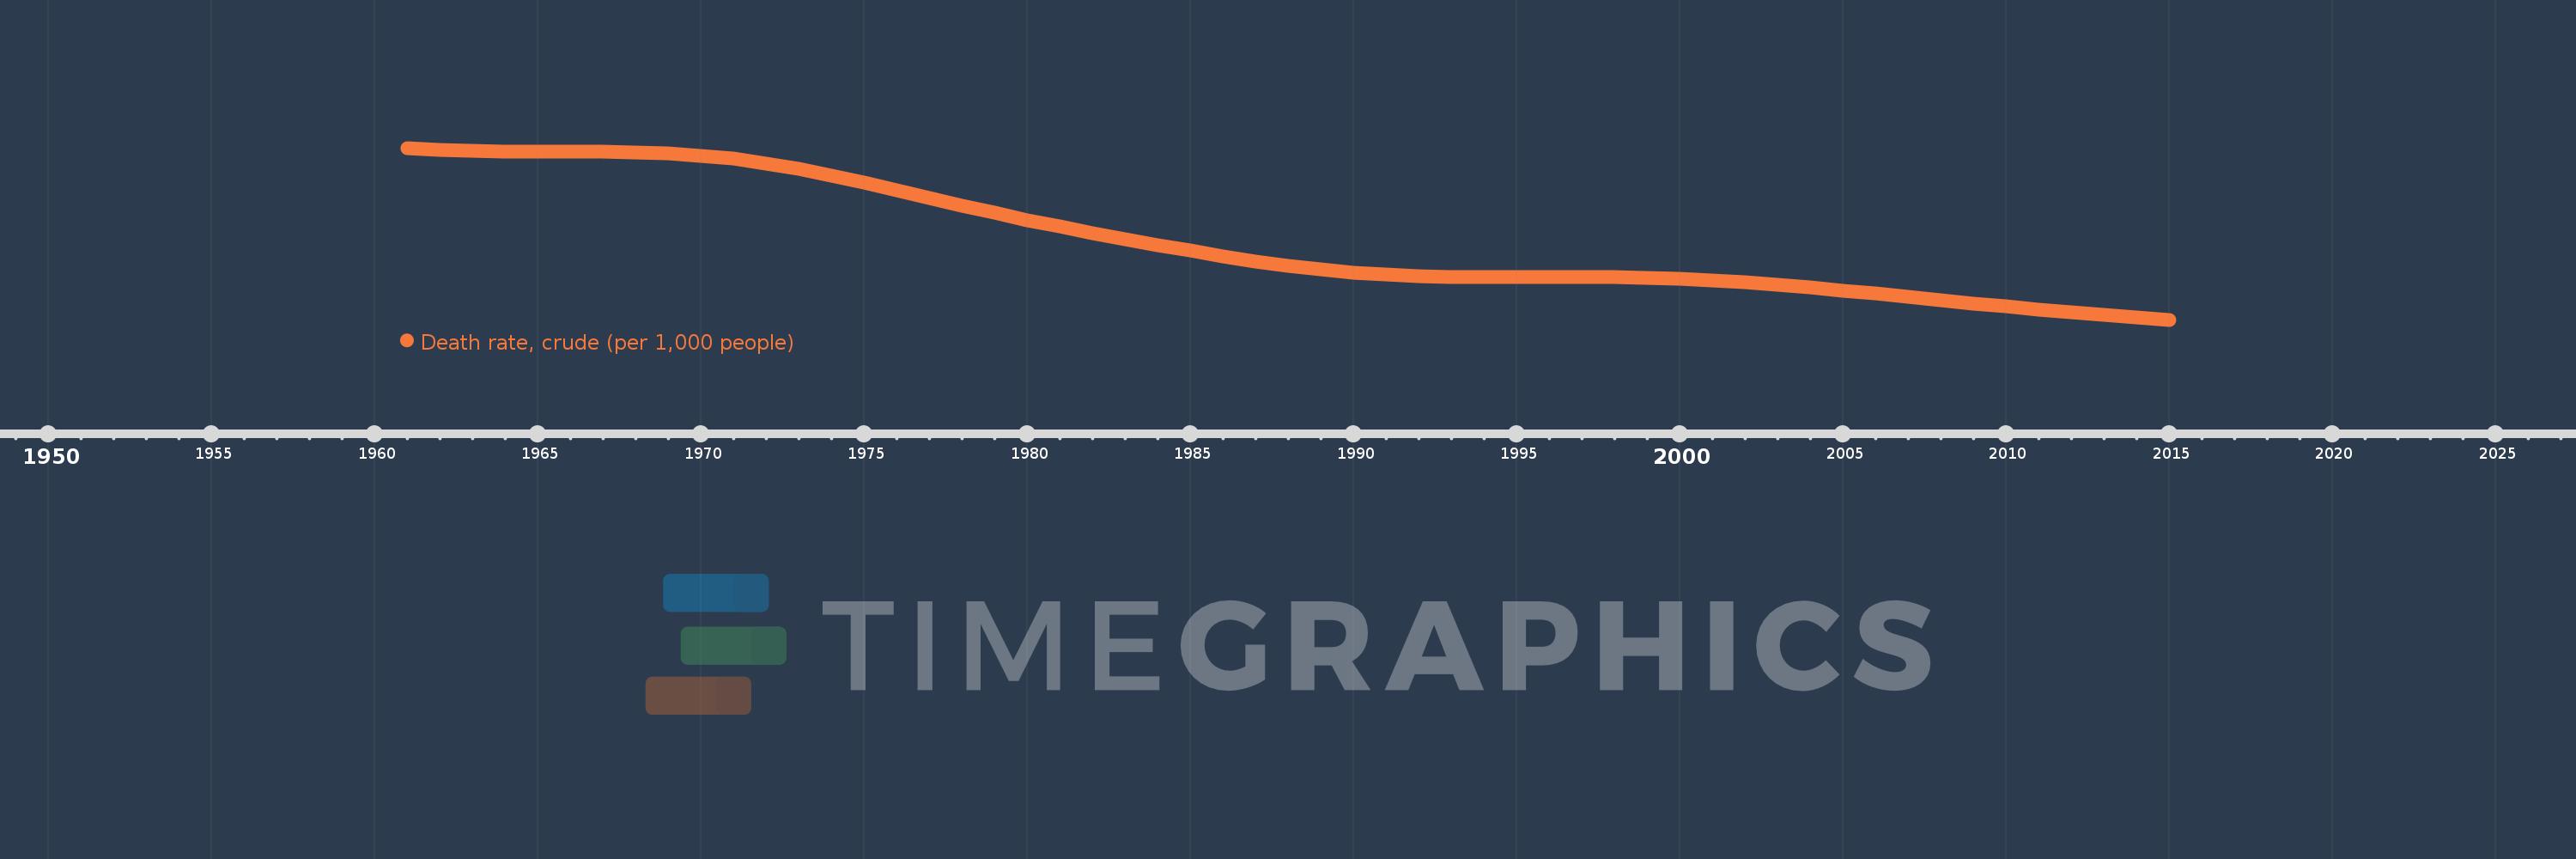
Death rate, crude (per 1,000 people)
2015,2014,2013,2012,2011,2010,2009,2008,2007,2006,2005,2004,2003,2002,2001,2000,1999,1998,1997,1996,1995,1994,1993,1992,1991,1990,1989,1988,1987,1986,1985,1984,1983,1982,1981,1980,1979,1978,1977,1976,1975,1974,1973,1972,1971,1970,1969,1968,1967,1966,1965,1964,1963,1962,1961
This statistics in other country:
AfghanistanAlbaniaAlgeriaAmerican SamoaAndorraAngolaAntigua and BarbudaArab WorldArgentinaArmeniaArubaAustraliaAustriaAzerbaijanBahamas, TheBahrainBangladeshBarbadosBelarusBelgiumBelizeBeninBermudaBhutanBoliviaBosnia and HerzegovinaBotswanaBrazilBrunei DarussalamBulgariaBurkina FasoBurundiCabo VerdeCambodiaCameroonCanadaCaribbean small statesCayman IslandsCentral African RepublicCentral Europe and the BalticsChadChannel IslandsChileChinaColombiaComorosCongo, Dem. Rep.Congo, Rep.Costa RicaCote d'IvoireCroatiaCubaCuracaoCyprusCzech RepublicDenmarkDjiboutiDominicaDominican RepublicEarly-demographic dividendEast Asia & PacificEast Asia & Pacific (excluding high income)East Asia & Pacific (IDA & IBRD countries)EcuadorEgypt, Arab Rep.El SalvadorEquatorial GuineaEritreaEstoniaEthiopiaEuro areaEurope & Central AsiaEurope & Central Asia (excluding high income)Europe & Central Asia (IDA & IBRD countries)European UnionFaroe IslandsFijiFinlandFragile and conflict affected situationsFranceFrench PolynesiaGabonGambia, TheGeorgiaGermanyGhanaGreeceGreenlandGrenadaGuamGuatemalaGuineaGuinea-BissauGuyanaHaitiHeavily indebted poor countries (HIPC)High incomeHondurasHong Kong SAR, ChinaHungaryIBRD onlyIcelandIDA & IBRD totalIDA blendIDA onlyIDA totalIndiaIndonesiaIran, Islamic Rep.IraqIrelandIsle of ManIsraelItalyJamaicaJapanJordanKazakhstanKenyaKiribatiKorea, Dem. People’s Rep.Korea, Rep.KosovoKuwaitKyrgyz RepublicLao PDRLate-demographic dividendLatin America & Caribbean Latin America & Caribbean (excluding high income)Latin America & the Caribbean (IDA & IBRD countries)LatviaLeast developed countries: UN classificationLebanonLesothoLiberiaLibyaLiechtensteinLithuaniaLow & middle incomeLow incomeLower middle incomeLuxembourgMacao SAR, ChinaMacedonia, FYRMadagascarMalawiMalaysiaMaldivesMaliMaltaMarshall IslandsMauritaniaMauritiusMexicoMicronesia, Fed. Sts.Middle East & North AfricaMiddle East & North Africa (excluding high income)Middle East & North Africa (IDA & IBRD countries)Middle incomeMoldovaMonacoMongoliaMontenegroMoroccoMozambiqueMyanmarNamibiaNepalNetherlandsNew CaledoniaNew ZealandNicaraguaNigerNigeriaNorth AmericaNorwayOECD membersOmanOther small statesPacific island small statesPakistanPalauPanamaPapua New GuineaParaguayPeruPhilippinesPolandPortugalPost-demographic dividendPre-demographic dividendPuerto RicoQatarRomaniaRussian FederationRwandaSamoaSan MarinoSao Tome and PrincipeSaudi ArabiaSenegalSerbiaSeychellesSierra LeoneSingaporeSint Maarten (Dutch part)Slovak RepublicSloveniaSmall statesSolomon IslandsSomaliaSouth AfricaSouth AsiaSouth Asia (IDA & IBRD)South SudanSpainSri LankaSt. Kitts and NevisSt. LuciaSt. Martin (French part)St. Vincent and the GrenadinesSub-Saharan Africa Sub-Saharan Africa (excluding high income)Sub-Saharan Africa (IDA & IBRD countries)SudanSurinameSwazilandSwedenSwitzerlandSyrian Arab RepublicTajikistanTanzaniaThailandTimor-LesteTogoTongaTrinidad and TobagoTunisiaTurkeyTurkmenistanUgandaUkraineUnited Arab EmiratesUnited KingdomUnited StatesUpper middle incomeUruguayUzbekistanVanuatuVenezuela, RBVietnamVirgin Islands (U.S.)West Bank and GazaWorldYemen, Rep.ZambiaZimbabwe Timeline:
This timeline shows a graph from 1961 to 2015 of Senegal. No data until 1960. Number of actual observations by date: 55.
Source name:
World Development Indicators
Source organization:
(1) United Nations Population Division. World Population Prospects, (2) Census reports and other statistical publications from national statistical offices, (3) Eurostat: Demographic Statistics, (4) United Nations Statistical Division. Population and Vital Statistics Reprot (various years), (5) U.S. Census Bureau: International Database, and (6) Secretariat of the Pacific Community: Statistics and Demography Programme.
Categories, topics:
Health
Last updated:
apr 23, 2017
Indicators value changes by year
Maximum:
26.053
jan 1, 1961
At the date of observation
Value
Absolute change
Change from previous value
jan 1, 1961
26.053
+26.053
0.0%
jan 1, 1962
25.858
-0.195
-0.75%
jan 1, 1963
25.734
-0.124
-0.48%
jan 1, 1964
25.672
-0.062
-0.24%
jan 1, 1965
25.655
-0.017
-0.07%
jan 1, 1966
25.654
-0.001
0.0%
jan 1, 1967
25.637
-0.017
-0.07%
jan 1, 1968
25.57
-0.067
-0.26%
jan 1, 1969
25.422
-0.148
-0.58%
jan 1, 1970
25.171
-0.251
-0.99%
jan 1, 1971
24.793
-0.378
-1.5%
jan 1, 1972
24.274
-0.519
-2.09%
jan 1, 1973
23.631
-0.643
-2.65%
jan 1, 1974
22.887
-0.744
-3.15%
jan 1, 1975
22.063
-0.824
-3.6%
jan 1, 1976
21.186
-0.877
-3.97%
jan 1, 1977
20.288
-0.898
-4.24%
jan 1, 1978
19.398
-0.89
-4.39%
jan 1, 1979
18.539
-0.859
-4.43%
jan 1, 1980
17.728
-0.811
-4.37%
jan 1, 1981
16.966
-0.762
-4.3%
jan 1, 1982
16.243
-0.723
-4.26%
jan 1, 1983
15.54
-0.703
-4.33%
jan 1, 1984
14.849
-0.691
-4.45%
jan 1, 1985
14.176
-0.673
-4.53%
jan 1, 1986
13.537
-0.639
-4.51%
jan 1, 1987
12.952
-0.585
-4.32%
jan 1, 1988
12.438
-0.514
-3.97%
jan 1, 1989
12.007
-0.431
-3.47%
jan 1, 1990
11.664
-0.343
-2.86%
jan 1, 1991
11.413
-0.251
-2.15%
jan 1, 1992
11.254
-0.159
-1.39%
jan 1, 1993
11.172
-0.082
-0.73%
jan 1, 1994
11.143
-0.029
-0.26%
jan 1, 1995
11.148
+0.005
0.04%
jan 1, 1996
11.162
+0.014
0.13%
jan 1, 1997
11.163
+0.001
0.01%
jan 1, 1998
11.137
-0.026
-0.23%
jan 1, 1999
11.069
-0.068
-0.61%
jan 1, 2000
10.949
-0.12
-1.08%
jan 1, 2001
10.77
-0.179
-1.63%
jan 1, 2002
10.531
-0.239
-2.22%
jan 1, 2003
10.248
-0.283
-2.69%
jan 1, 2004
9.933
-0.315
-3.07%
jan 1, 2005
9.594
-0.339
-3.41%
jan 1, 2006
9.237
-0.357
-3.72%
jan 1, 2007
8.865
-0.372
-4.03%
jan 1, 2008
8.484
-0.381
-4.3%
jan 1, 2009
8.101
-0.383
-4.51%
jan 1, 2010
7.725
-0.376
-4.64%
jan 1, 2011
7.366
-0.359
-4.65%
jan 1, 2012
7.032
-0.334
-4.53%
jan 1, 2013
6.726
-0.306
-4.35%
jan 1, 2014
6.45
-0.276
-4.1%
jan 1, 2015
6.205
-0.245
-3.8%
Ranking of countries by current statistics by years


Comments: