29
/
en
AIzaSyAYiBZKx7MnpbEhh9jyipgxe19OcubqV5w
April 1, 2024
24789
Caribbean small states
CSS
false
2
1
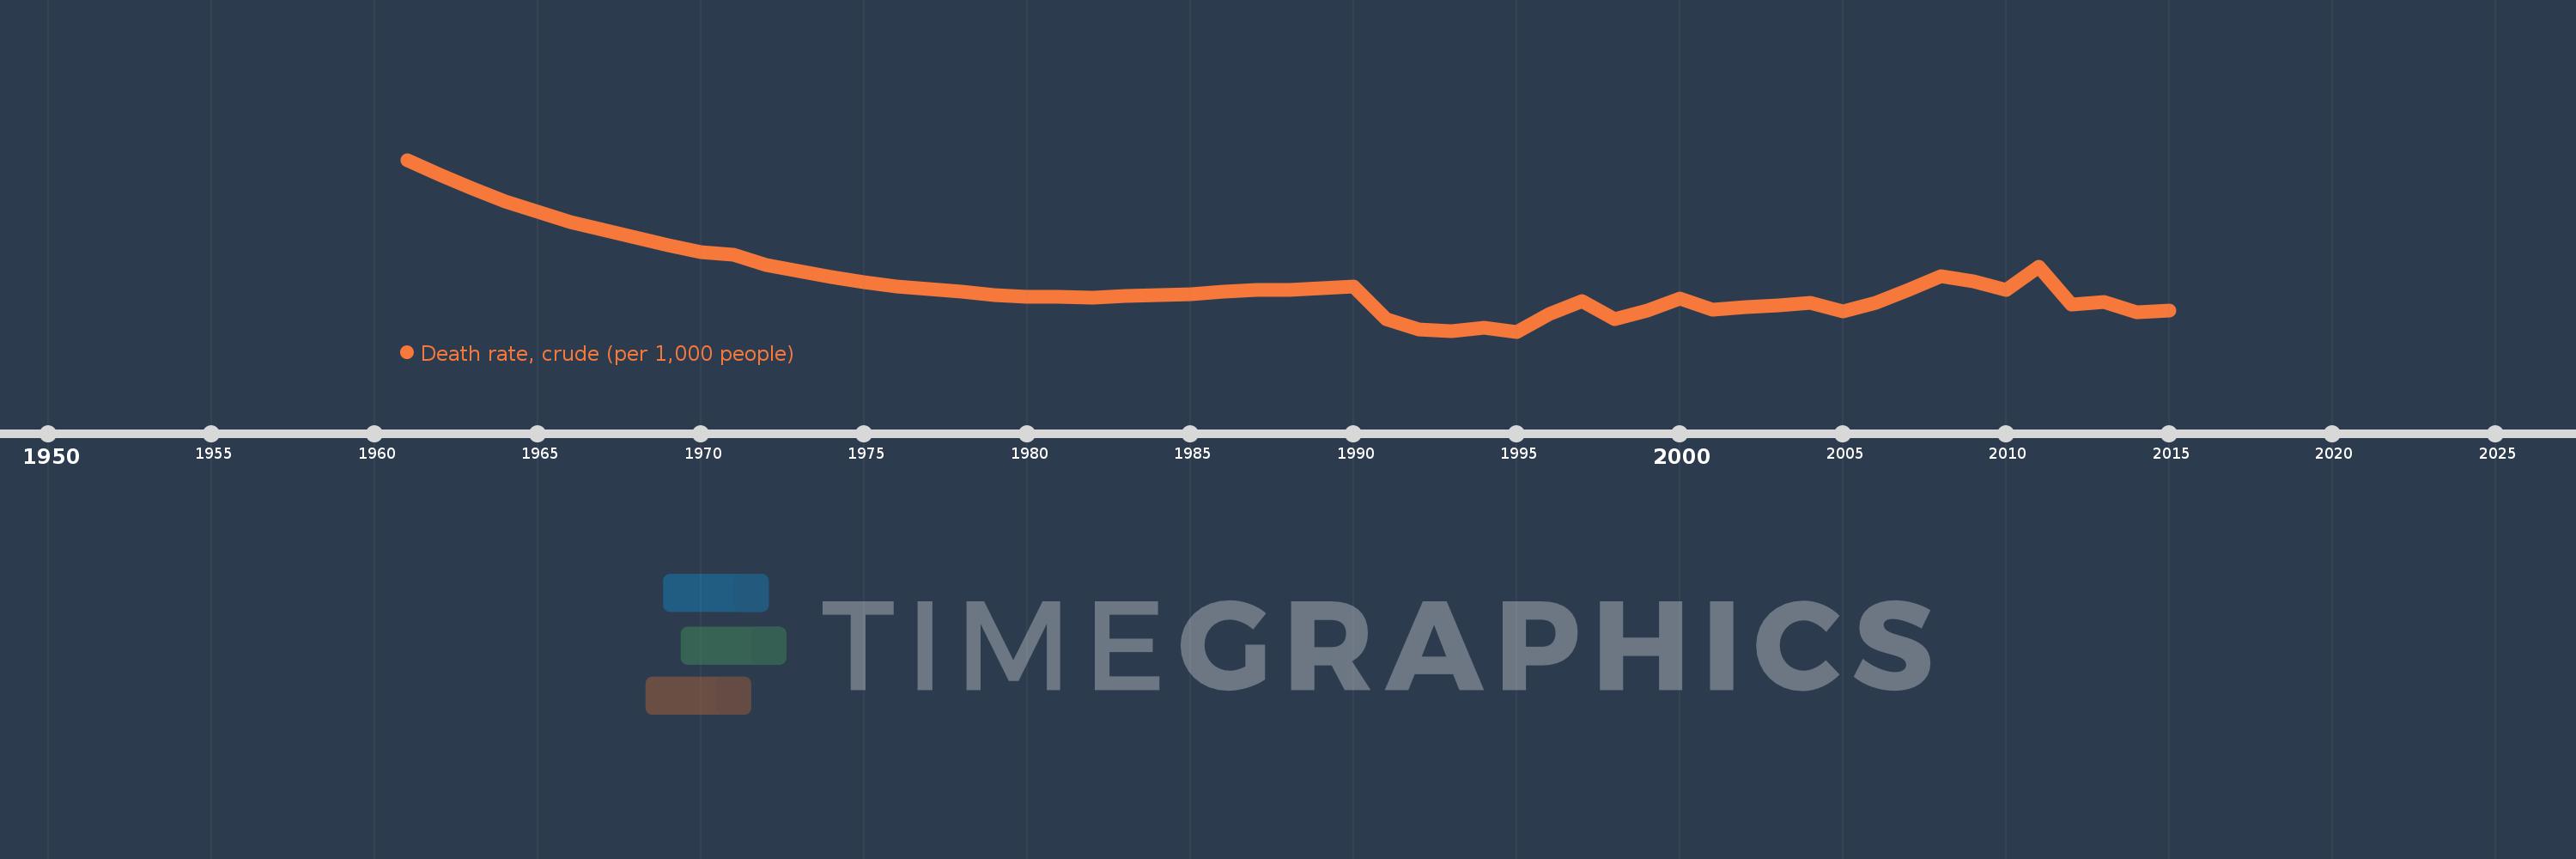
Death rate, crude (per 1,000 people)
2015,2014,2013,2012,2011,2010,2009,2008,2007,2006,2005,2004,2003,2002,2001,2000,1999,1998,1997,1996,1995,1994,1993,1992,1991,1990,1989,1988,1987,1986,1985,1984,1983,1982,1981,1980,1979,1978,1977,1976,1975,1974,1973,1972,1971,1970,1969,1968,1967,1966,1965,1964,1963,1962,1961
This statistics in other country:
AfghanistanAlbaniaAlgeriaAmerican SamoaAndorraAngolaAntigua and BarbudaArab WorldArgentinaArmeniaArubaAustraliaAustriaAzerbaijanBahamas, TheBahrainBangladeshBarbadosBelarusBelgiumBelizeBeninBermudaBhutanBoliviaBosnia and HerzegovinaBotswanaBrazilBrunei DarussalamBulgariaBurkina FasoBurundiCabo VerdeCambodiaCameroonCanadaCaribbean small statesCayman IslandsCentral African RepublicCentral Europe and the BalticsChadChannel IslandsChileChinaColombiaComorosCongo, Dem. Rep.Congo, Rep.Costa RicaCote d'IvoireCroatiaCubaCuracaoCyprusCzech RepublicDenmarkDjiboutiDominicaDominican RepublicEarly-demographic dividendEast Asia & PacificEast Asia & Pacific (excluding high income)East Asia & Pacific (IDA & IBRD countries)EcuadorEgypt, Arab Rep.El SalvadorEquatorial GuineaEritreaEstoniaEthiopiaEuro areaEurope & Central AsiaEurope & Central Asia (excluding high income)Europe & Central Asia (IDA & IBRD countries)European UnionFaroe IslandsFijiFinlandFragile and conflict affected situationsFranceFrench PolynesiaGabonGambia, TheGeorgiaGermanyGhanaGreeceGreenlandGrenadaGuamGuatemalaGuineaGuinea-BissauGuyanaHaitiHeavily indebted poor countries (HIPC)High incomeHondurasHong Kong SAR, ChinaHungaryIBRD onlyIcelandIDA & IBRD totalIDA blendIDA onlyIDA totalIndiaIndonesiaIran, Islamic Rep.IraqIrelandIsle of ManIsraelItalyJamaicaJapanJordanKazakhstanKenyaKiribatiKorea, Dem. People’s Rep.Korea, Rep.KosovoKuwaitKyrgyz RepublicLao PDRLate-demographic dividendLatin America & Caribbean Latin America & Caribbean (excluding high income)Latin America & the Caribbean (IDA & IBRD countries)LatviaLeast developed countries: UN classificationLebanonLesothoLiberiaLibyaLiechtensteinLithuaniaLow & middle incomeLow incomeLower middle incomeLuxembourgMacao SAR, ChinaMacedonia, FYRMadagascarMalawiMalaysiaMaldivesMaliMaltaMarshall IslandsMauritaniaMauritiusMexicoMicronesia, Fed. Sts.Middle East & North AfricaMiddle East & North Africa (excluding high income)Middle East & North Africa (IDA & IBRD countries)Middle incomeMoldovaMonacoMongoliaMontenegroMoroccoMozambiqueMyanmarNamibiaNepalNetherlandsNew CaledoniaNew ZealandNicaraguaNigerNigeriaNorth AmericaNorwayOECD membersOmanOther small statesPacific island small statesPakistanPalauPanamaPapua New GuineaParaguayPeruPhilippinesPolandPortugalPost-demographic dividendPre-demographic dividendPuerto RicoQatarRomaniaRussian FederationRwandaSamoaSan MarinoSao Tome and PrincipeSaudi ArabiaSenegalSerbiaSeychellesSierra LeoneSingaporeSint Maarten (Dutch part)Slovak RepublicSloveniaSmall statesSolomon IslandsSomaliaSouth AfricaSouth AsiaSouth Asia (IDA & IBRD)South SudanSpainSri LankaSt. Kitts and NevisSt. LuciaSt. Martin (French part)St. Vincent and the GrenadinesSub-Saharan Africa Sub-Saharan Africa (excluding high income)Sub-Saharan Africa (IDA & IBRD countries)SudanSurinameSwazilandSwedenSwitzerlandSyrian Arab RepublicTajikistanTanzaniaThailandTimor-LesteTogoTongaTrinidad and TobagoTunisiaTurkeyTurkmenistanUgandaUkraineUnited Arab EmiratesUnited KingdomUnited StatesUpper middle incomeUruguayUzbekistanVanuatuVenezuela, RBVietnamVirgin Islands (U.S.)West Bank and GazaWorldYemen, Rep.ZambiaZimbabwe Timeline:
This timeline shows a graph from 1961 to 2015 of Caribbean small states. No data until 1960. Number of actual observations by date: 55.
Source name:
World Development Indicators
Source organization:
(1) United Nations Population Division. World Population Prospects, (2) Census reports and other statistical publications from national statistical offices, (3) Eurostat: Demographic Statistics, (4) United Nations Statistical Division. Population and Vital Statistics Reprot (various years), (5) U.S. Census Bureau: International Database, and (6) Secretariat of the Pacific Community: Statistics and Demography Programme.
Categories, topics:
Health
Last updated:
apr 23, 2017
Indicators value changes by year
At the date of observation
Value
Absolute change
Change from previous value
jan 1, 1961
9.813
+9.813
0.0%
jan 1, 1962
9.547
-0.266
-2.72%
jan 1, 1963
9.3
-0.246
-2.58%
jan 1, 1964
9.078
-0.223
-2.39%
jan 1, 1965
8.882
-0.196
-2.16%
jan 1, 1966
8.71
-0.171
-1.93%
jan 1, 1967
8.561
-0.149
-1.72%
jan 1, 1968
8.426
-0.135
-1.58%
jan 1, 1969
8.299
-0.126
-1.5%
jan 1, 1970
8.178
-0.121
-1.46%
jan 1, 1971
8.128
-0.05
-0.61%
jan 1, 1972
7.947
-0.182
-2.24%
jan 1, 1973
7.837
-0.11
-1.38%
jan 1, 1974
7.734
-0.102
-1.31%
jan 1, 1975
7.641
-0.094
-1.21%
jan 1, 1976
7.558
-0.082
-1.08%
jan 1, 1977
7.509
-0.049
-0.65%
jan 1, 1978
7.471
-0.038
-0.51%
jan 1, 1979
7.406
-0.065
-0.87%
jan 1, 1980
7.374
-0.032
-0.43%
jan 1, 1981
7.374
+0.0
0.0%
jan 1, 1982
7.36
-0.014
-0.19%
jan 1, 1983
7.391
+0.031
0.42%
jan 1, 1984
7.4
+0.009
0.12%
jan 1, 1985
7.424
+0.024
0.33%
jan 1, 1986
7.47
+0.045
0.61%
jan 1, 1987
7.493
+0.023
0.31%
jan 1, 1988
7.497
+0.005
0.06%
jan 1, 1989
7.533
+0.035
0.47%
jan 1, 1990
7.554
+0.021
0.28%
jan 1, 1991
6.987
-0.566
-7.5%
jan 1, 1992
6.792
-0.195
-2.79%
jan 1, 1993
6.759
-0.033
-0.49%
jan 1, 1994
6.828
+0.069
1.02%
jan 1, 1995
6.758
-0.07
-1.02%
jan 1, 1996
7.065
+0.307
4.55%
jan 1, 1997
7.297
+0.232
3.28%
jan 1, 1998
6.981
-0.317
-4.34%
jan 1, 1999
7.135
+0.155
2.21%
jan 1, 2000
7.343
+0.208
2.91%
jan 1, 2001
7.146
-0.197
-2.68%
jan 1, 2002
7.186
+0.039
0.55%
jan 1, 2003
7.219
+0.033
0.46%
jan 1, 2004
7.266
+0.048
0.66%
jan 1, 2005
7.112
-0.154
-2.12%
jan 1, 2006
7.272
+0.16
2.25%
jan 1, 2007
7.503
+0.231
3.17%
jan 1, 2008
7.74
+0.237
3.16%
jan 1, 2009
7.651
-0.089
-1.15%
jan 1, 2010
7.492
-0.159
-2.07%
jan 1, 2011
7.904
+0.412
5.5%
jan 1, 2012
7.244
-0.66
-8.35%
jan 1, 2013
7.285
+0.04
0.56%
jan 1, 2014
7.095
-0.19
-2.61%
jan 1, 2015
7.139
+0.044
0.62%
Ranking of countries by current statistics by years


Comments: