29
/
en
AIzaSyAYiBZKx7MnpbEhh9jyipgxe19OcubqV5w
April 1, 2024
25586
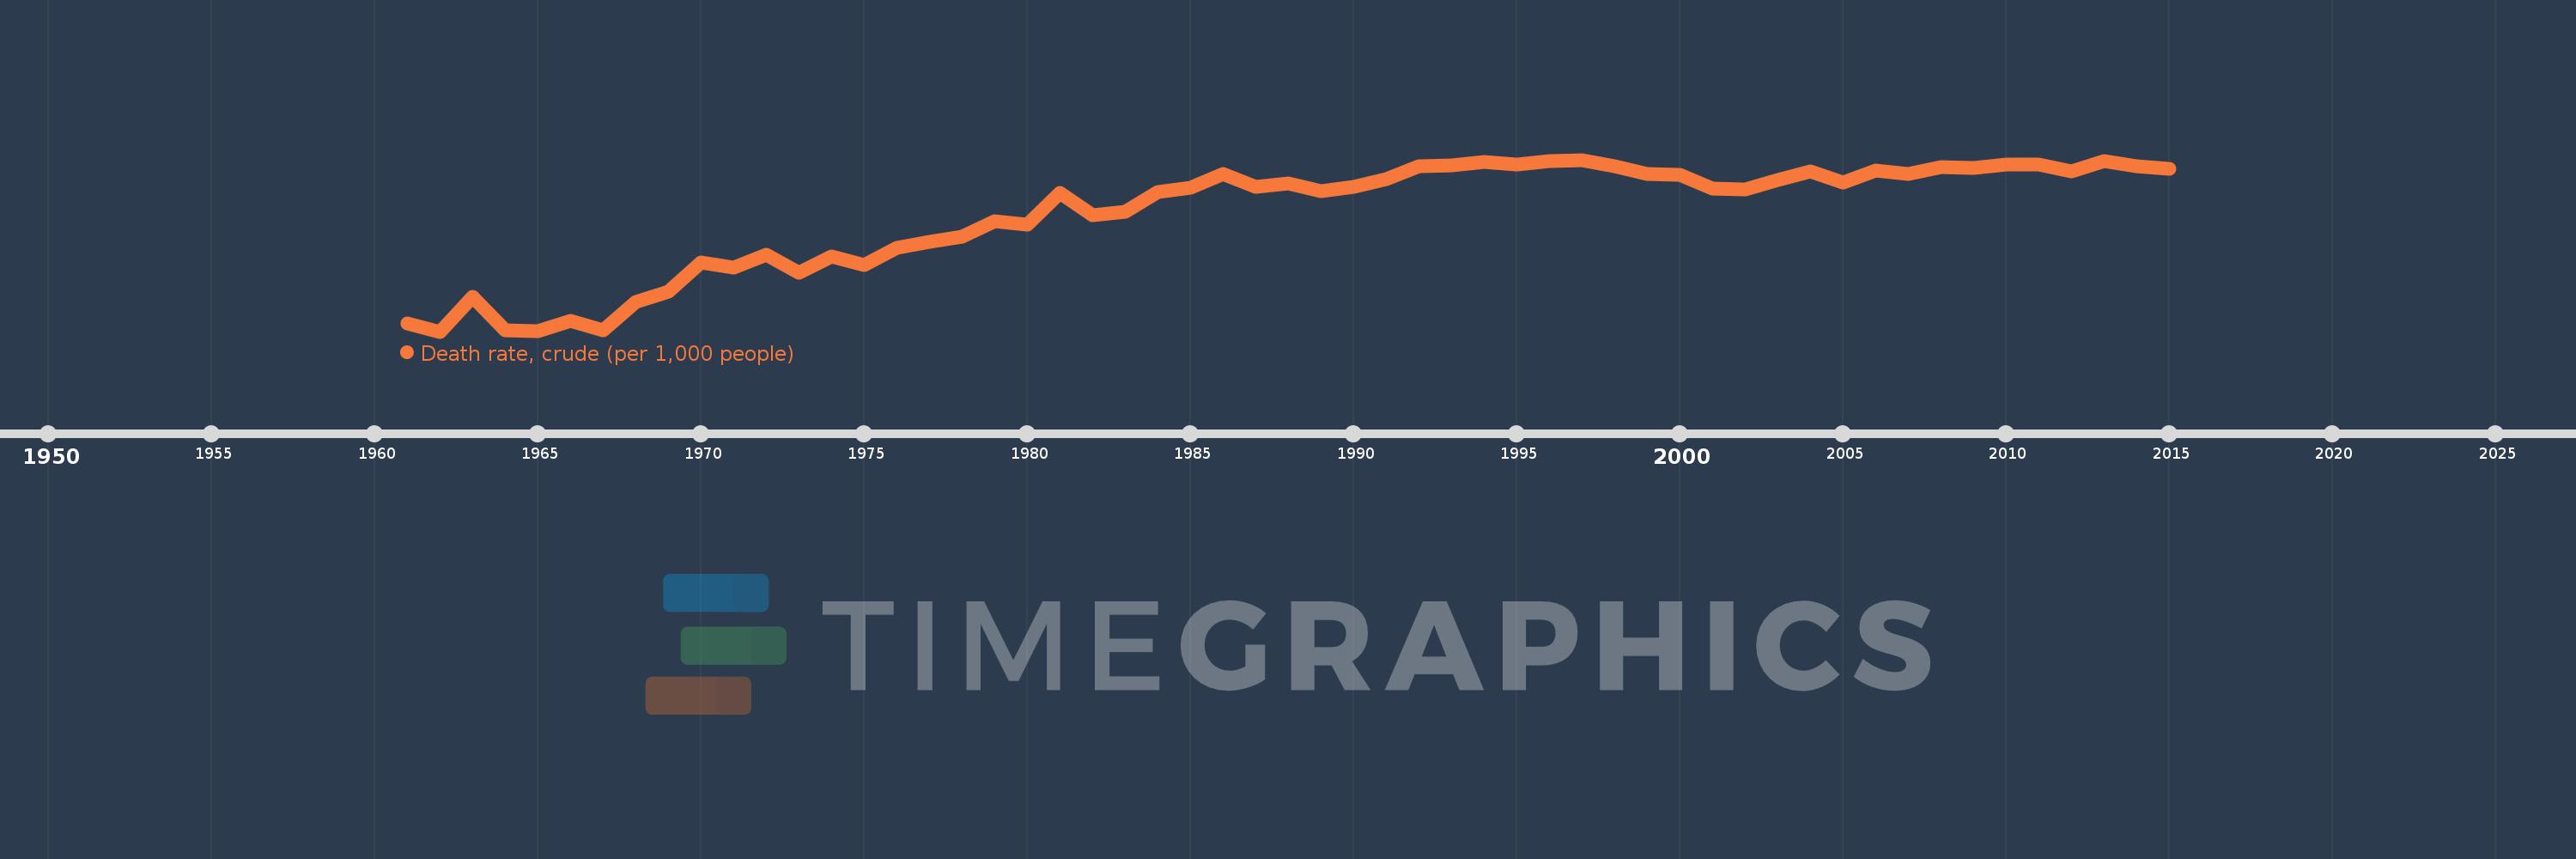
Central Europe and the Baltics
CEB
false
2
1
Death rate, crude (per 1,000 people)
2015,2014,2013,2012,2011,2010,2009,2008,2007,2006,2005,2004,2003,2002,2001,2000,1999,1998,1997,1996,1995,1994,1993,1992,1991,1990,1989,1988,1987,1986,1985,1984,1983,1982,1981,1980,1979,1978,1977,1976,1975,1974,1973,1972,1971,1970,1969,1968,1967,1966,1965,1964,1963,1962,1961
This statistics in other country:
AfghanistanAlbaniaAlgeriaAmerican SamoaAndorraAngolaAntigua and BarbudaArab WorldArgentinaArmeniaArubaAustraliaAustriaAzerbaijanBahamas, TheBahrainBangladeshBarbadosBelarusBelgiumBelizeBeninBermudaBhutanBoliviaBosnia and HerzegovinaBotswanaBrazilBrunei DarussalamBulgariaBurkina FasoBurundiCabo VerdeCambodiaCameroonCanadaCaribbean small statesCayman IslandsCentral African RepublicCentral Europe and the BalticsChadChannel IslandsChileChinaColombiaComorosCongo, Dem. Rep.Congo, Rep.Costa RicaCote d'IvoireCroatiaCubaCuracaoCyprusCzech RepublicDenmarkDjiboutiDominicaDominican RepublicEarly-demographic dividendEast Asia & PacificEast Asia & Pacific (excluding high income)East Asia & Pacific (IDA & IBRD countries)EcuadorEgypt, Arab Rep.El SalvadorEquatorial GuineaEritreaEstoniaEthiopiaEuro areaEurope & Central AsiaEurope & Central Asia (excluding high income)Europe & Central Asia (IDA & IBRD countries)European UnionFaroe IslandsFijiFinlandFragile and conflict affected situationsFranceFrench PolynesiaGabonGambia, TheGeorgiaGermanyGhanaGreeceGreenlandGrenadaGuamGuatemalaGuineaGuinea-BissauGuyanaHaitiHeavily indebted poor countries (HIPC)High incomeHondurasHong Kong SAR, ChinaHungaryIBRD onlyIcelandIDA & IBRD totalIDA blendIDA onlyIDA totalIndiaIndonesiaIran, Islamic Rep.IraqIrelandIsle of ManIsraelItalyJamaicaJapanJordanKazakhstanKenyaKiribatiKorea, Dem. People’s Rep.Korea, Rep.KosovoKuwaitKyrgyz RepublicLao PDRLate-demographic dividendLatin America & Caribbean Latin America & Caribbean (excluding high income)Latin America & the Caribbean (IDA & IBRD countries)LatviaLeast developed countries: UN classificationLebanonLesothoLiberiaLibyaLiechtensteinLithuaniaLow & middle incomeLow incomeLower middle incomeLuxembourgMacao SAR, ChinaMacedonia, FYRMadagascarMalawiMalaysiaMaldivesMaliMaltaMarshall IslandsMauritaniaMauritiusMexicoMicronesia, Fed. Sts.Middle East & North AfricaMiddle East & North Africa (excluding high income)Middle East & North Africa (IDA & IBRD countries)Middle incomeMoldovaMonacoMongoliaMontenegroMoroccoMozambiqueMyanmarNamibiaNepalNetherlandsNew CaledoniaNew ZealandNicaraguaNigerNigeriaNorth AmericaNorwayOECD membersOmanOther small statesPacific island small statesPakistanPalauPanamaPapua New GuineaParaguayPeruPhilippinesPolandPortugalPost-demographic dividendPre-demographic dividendPuerto RicoQatarRomaniaRussian FederationRwandaSamoaSan MarinoSao Tome and PrincipeSaudi ArabiaSenegalSerbiaSeychellesSierra LeoneSingaporeSint Maarten (Dutch part)Slovak RepublicSloveniaSmall statesSolomon IslandsSomaliaSouth AfricaSouth AsiaSouth Asia (IDA & IBRD)South SudanSpainSri LankaSt. Kitts and NevisSt. LuciaSt. Martin (French part)St. Vincent and the GrenadinesSub-Saharan Africa Sub-Saharan Africa (excluding high income)Sub-Saharan Africa (IDA & IBRD countries)SudanSurinameSwazilandSwedenSwitzerlandSyrian Arab RepublicTajikistanTanzaniaThailandTimor-LesteTogoTongaTrinidad and TobagoTunisiaTurkeyTurkmenistanUgandaUkraineUnited Arab EmiratesUnited KingdomUnited StatesUpper middle incomeUruguayUzbekistanVanuatuVenezuela, RBVietnamVirgin Islands (U.S.)West Bank and GazaWorldYemen, Rep.ZambiaZimbabwe Timeline:
This timeline shows a graph from 1961 to 2015 of Central Europe and the Baltics. No data until 1960. Number of actual observations by date: 55.
Source name:
World Development Indicators
Source organization:
(1) United Nations Population Division. World Population Prospects, (2) Census reports and other statistical publications from national statistical offices, (3) Eurostat: Demographic Statistics, (4) United Nations Statistical Division. Population and Vital Statistics Reprot (various years), (5) U.S. Census Bureau: International Database, and (6) Secretariat of the Pacific Community: Statistics and Demography Programme.
Categories, topics:
Health
Last updated:
apr 23, 2017
Indicators value changes by year
At the date of observation
Value
Absolute change
Change from previous value
jan 1, 1961
8.632
+8.632
0.0%
jan 1, 1962
8.495
-0.137
-1.59%
jan 1, 1963
9.115
+0.62
7.3%
jan 1, 1964
8.511
-0.604
-6.62%
jan 1, 1965
8.506
-0.005
-0.06%
jan 1, 1966
8.679
+0.173
2.04%
jan 1, 1967
8.513
-0.166
-1.91%
jan 1, 1968
9.021
+0.508
5.97%
jan 1, 1969
9.198
+0.176
1.95%
jan 1, 1970
9.711
+0.514
5.59%
jan 1, 1971
9.625
-0.086
-0.89%
jan 1, 1972
9.856
+0.231
2.4%
jan 1, 1973
9.528
-0.328
-3.33%
jan 1, 1974
9.822
+0.294
3.09%
jan 1, 1975
9.665
-0.157
-1.6%
jan 1, 1976
9.973
+0.308
3.18%
jan 1, 1977
10.074
+0.101
1.01%
jan 1, 1978
10.172
+0.099
0.98%
jan 1, 1979
10.436
+0.264
2.59%
jan 1, 1980
10.375
-0.061
-0.59%
jan 1, 1981
10.94
+0.565
5.44%
jan 1, 1982
10.551
-0.389
-3.55%
jan 1, 1983
10.602
+0.051
0.48%
jan 1, 1984
10.949
+0.347
3.27%
jan 1, 1985
11.029
+0.08
0.73%
jan 1, 1986
11.276
+0.247
2.24%
jan 1, 1987
11.043
-0.234
-2.07%
jan 1, 1988
11.104
+0.062
0.56%
jan 1, 1989
10.969
-0.136
-1.22%
jan 1, 1990
11.049
+0.08
0.73%
jan 1, 1991
11.175
+0.126
1.14%
jan 1, 1992
11.414
+0.239
2.14%
jan 1, 1993
11.422
+0.008
0.07%
jan 1, 1994
11.484
+0.063
0.55%
jan 1, 1995
11.434
-0.051
-0.44%
jan 1, 1996
11.495
+0.061
0.53%
jan 1, 1997
11.52
+0.026
0.22%
jan 1, 1998
11.409
-0.111
-0.97%
jan 1, 1999
11.277
-0.132
-1.15%
jan 1, 2000
11.256
-0.022
-0.19%
jan 1, 2001
11.007
-0.249
-2.21%
jan 1, 2002
11.004
-0.002
-0.02%
jan 1, 2003
11.158
+0.154
1.4%
jan 1, 2004
11.314
+0.156
1.4%
jan 1, 2005
11.112
-0.203
-1.79%
jan 1, 2006
11.333
+0.222
2.0%
jan 1, 2007
11.275
-0.059
-0.52%
jan 1, 2008
11.39
+0.115
1.02%
jan 1, 2009
11.373
-0.017
-0.15%
jan 1, 2010
11.435
+0.062
0.55%
jan 1, 2011
11.43
-0.005
-0.04%
jan 1, 2012
11.317
-0.113
-0.99%
jan 1, 2013
11.497
+0.18
1.59%
jan 1, 2014
11.411
-0.086
-0.75%
jan 1, 2015
11.356
-0.055
-0.48%
Ranking of countries by current statistics by years


Comments: