29
/
en
AIzaSyAYiBZKx7MnpbEhh9jyipgxe19OcubqV5w
April 1, 2024
85770
Bhutan
BTN
true
2
1
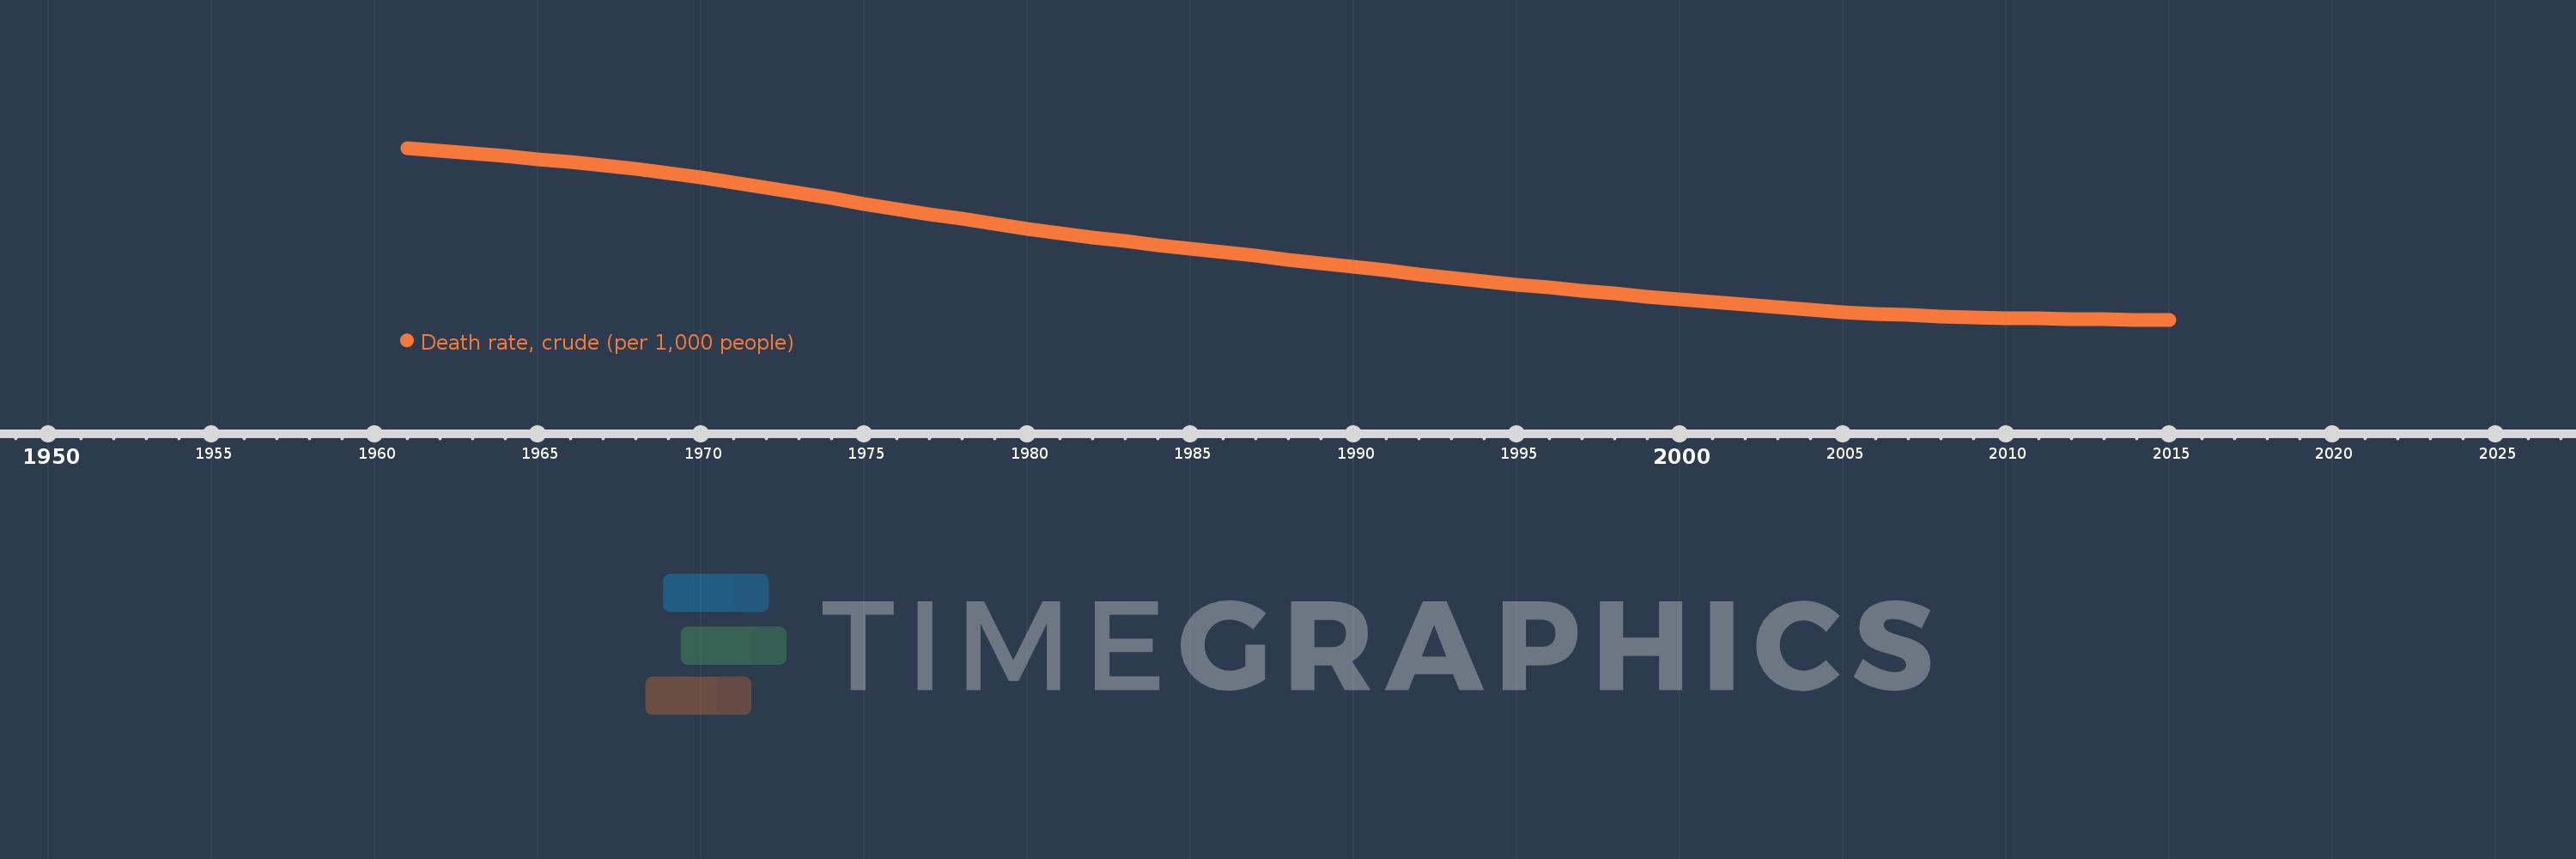
Death rate, crude (per 1,000 people)
2015,2014,2013,2012,2011,2010,2009,2008,2007,2006,2005,2004,2003,2002,2001,2000,1999,1998,1997,1996,1995,1994,1993,1992,1991,1990,1989,1988,1987,1986,1985,1984,1983,1982,1981,1980,1979,1978,1977,1976,1975,1974,1973,1972,1971,1970,1969,1968,1967,1966,1965,1964,1963,1962,1961
This statistics in other country:
AfghanistanAlbaniaAlgeriaAmerican SamoaAndorraAngolaAntigua and BarbudaArab WorldArgentinaArmeniaArubaAustraliaAustriaAzerbaijanBahamas, TheBahrainBangladeshBarbadosBelarusBelgiumBelizeBeninBermudaBhutanBoliviaBosnia and HerzegovinaBotswanaBrazilBrunei DarussalamBulgariaBurkina FasoBurundiCabo VerdeCambodiaCameroonCanadaCaribbean small statesCayman IslandsCentral African RepublicCentral Europe and the BalticsChadChannel IslandsChileChinaColombiaComorosCongo, Dem. Rep.Congo, Rep.Costa RicaCote d'IvoireCroatiaCubaCuracaoCyprusCzech RepublicDenmarkDjiboutiDominicaDominican RepublicEarly-demographic dividendEast Asia & PacificEast Asia & Pacific (excluding high income)East Asia & Pacific (IDA & IBRD countries)EcuadorEgypt, Arab Rep.El SalvadorEquatorial GuineaEritreaEstoniaEthiopiaEuro areaEurope & Central AsiaEurope & Central Asia (excluding high income)Europe & Central Asia (IDA & IBRD countries)European UnionFaroe IslandsFijiFinlandFragile and conflict affected situationsFranceFrench PolynesiaGabonGambia, TheGeorgiaGermanyGhanaGreeceGreenlandGrenadaGuamGuatemalaGuineaGuinea-BissauGuyanaHaitiHeavily indebted poor countries (HIPC)High incomeHondurasHong Kong SAR, ChinaHungaryIBRD onlyIcelandIDA & IBRD totalIDA blendIDA onlyIDA totalIndiaIndonesiaIran, Islamic Rep.IraqIrelandIsle of ManIsraelItalyJamaicaJapanJordanKazakhstanKenyaKiribatiKorea, Dem. People’s Rep.Korea, Rep.KosovoKuwaitKyrgyz RepublicLao PDRLate-demographic dividendLatin America & Caribbean Latin America & Caribbean (excluding high income)Latin America & the Caribbean (IDA & IBRD countries)LatviaLeast developed countries: UN classificationLebanonLesothoLiberiaLibyaLiechtensteinLithuaniaLow & middle incomeLow incomeLower middle incomeLuxembourgMacao SAR, ChinaMacedonia, FYRMadagascarMalawiMalaysiaMaldivesMaliMaltaMarshall IslandsMauritaniaMauritiusMexicoMicronesia, Fed. Sts.Middle East & North AfricaMiddle East & North Africa (excluding high income)Middle East & North Africa (IDA & IBRD countries)Middle incomeMoldovaMonacoMongoliaMontenegroMoroccoMozambiqueMyanmarNamibiaNepalNetherlandsNew CaledoniaNew ZealandNicaraguaNigerNigeriaNorth AmericaNorwayOECD membersOmanOther small statesPacific island small statesPakistanPalauPanamaPapua New GuineaParaguayPeruPhilippinesPolandPortugalPost-demographic dividendPre-demographic dividendPuerto RicoQatarRomaniaRussian FederationRwandaSamoaSan MarinoSao Tome and PrincipeSaudi ArabiaSenegalSerbiaSeychellesSierra LeoneSingaporeSint Maarten (Dutch part)Slovak RepublicSloveniaSmall statesSolomon IslandsSomaliaSouth AfricaSouth AsiaSouth Asia (IDA & IBRD)South SudanSpainSri LankaSt. Kitts and NevisSt. LuciaSt. Martin (French part)St. Vincent and the GrenadinesSub-Saharan Africa Sub-Saharan Africa (excluding high income)Sub-Saharan Africa (IDA & IBRD countries)SudanSurinameSwazilandSwedenSwitzerlandSyrian Arab RepublicTajikistanTanzaniaThailandTimor-LesteTogoTongaTrinidad and TobagoTunisiaTurkeyTurkmenistanUgandaUkraineUnited Arab EmiratesUnited KingdomUnited StatesUpper middle incomeUruguayUzbekistanVanuatuVenezuela, RBVietnamVirgin Islands (U.S.)West Bank and GazaWorldYemen, Rep.ZambiaZimbabwe Timeline:
This timeline shows a graph from 1961 to 2015 of Bhutan. No data until 1960. Number of actual observations by date: 55.
Source name:
World Development Indicators
Source organization:
(1) United Nations Population Division. World Population Prospects, (2) Census reports and other statistical publications from national statistical offices, (3) Eurostat: Demographic Statistics, (4) United Nations Statistical Division. Population and Vital Statistics Reprot (various years), (5) U.S. Census Bureau: International Database, and (6) Secretariat of the Pacific Community: Statistics and Demography Programme.
Categories, topics:
Health
Last updated:
apr 23, 2017
Indicators value changes by year
Maximum:
31.266
jan 1, 1961
At the date of observation
Value
Absolute change
Change from previous value
jan 1, 1961
31.266
+31.266
0.0%
jan 1, 1962
30.852
-0.414
-1.32%
jan 1, 1963
30.448
-0.404
-1.31%
jan 1, 1964
30.048
-0.4
-1.31%
jan 1, 1965
29.642
-0.406
-1.35%
jan 1, 1966
29.212
-0.43
-1.45%
jan 1, 1967
28.74
-0.472
-1.62%
jan 1, 1968
28.212
-0.528
-1.84%
jan 1, 1969
27.623
-0.589
-2.09%
jan 1, 1970
26.973
-0.65
-2.35%
jan 1, 1971
26.265
-0.708
-2.62%
jan 1, 1972
25.511
-0.754
-2.87%
jan 1, 1973
24.728
-0.783
-3.07%
jan 1, 1974
23.937
-0.791
-3.2%
jan 1, 1975
23.151
-0.786
-3.28%
jan 1, 1976
22.38
-0.771
-3.33%
jan 1, 1977
21.63
-0.75
-3.35%
jan 1, 1978
20.903
-0.727
-3.36%
jan 1, 1979
20.198
-0.705
-3.37%
jan 1, 1980
19.519
-0.679
-3.36%
jan 1, 1981
18.87
-0.649
-3.32%
jan 1, 1982
18.256
-0.614
-3.25%
jan 1, 1983
17.671
-0.585
-3.2%
jan 1, 1984
17.113
-0.558
-3.16%
jan 1, 1985
16.575
-0.538
-3.14%
jan 1, 1986
16.049
-0.526
-3.17%
jan 1, 1987
15.527
-0.522
-3.25%
jan 1, 1988
15.002
-0.525
-3.38%
jan 1, 1989
14.471
-0.531
-3.54%
jan 1, 1990
13.934
-0.537
-3.71%
jan 1, 1991
13.395
-0.539
-3.87%
jan 1, 1992
12.862
-0.533
-3.98%
jan 1, 1993
12.344
-0.518
-4.03%
jan 1, 1994
11.847
-0.497
-4.03%
jan 1, 1995
11.374
-0.473
-3.99%
jan 1, 1996
10.921
-0.453
-3.98%
jan 1, 1997
10.482
-0.439
-4.02%
jan 1, 1998
10.049
-0.433
-4.13%
jan 1, 1999
9.62
-0.429
-4.27%
jan 1, 2000
9.197
-0.423
-4.4%
jan 1, 2001
8.785
-0.412
-4.48%
jan 1, 2002
8.389
-0.396
-4.51%
jan 1, 2003
8.019
-0.37
-4.41%
jan 1, 2004
7.68
-0.339
-4.23%
jan 1, 2005
7.379
-0.301
-3.92%
jan 1, 2006
7.118
-0.261
-3.54%
jan 1, 2007
6.9
-0.218
-3.06%
jan 1, 2008
6.721
-0.179
-2.59%
jan 1, 2009
6.578
-0.143
-2.13%
jan 1, 2010
6.465
-0.113
-1.72%
jan 1, 2011
6.381
-0.084
-1.3%
jan 1, 2012
6.319
-0.062
-0.97%
jan 1, 2013
6.277
-0.042
-0.66%
jan 1, 2014
6.248
-0.029
-0.46%
jan 1, 2015
6.23
-0.018
-0.29%
Ranking of countries by current statistics by years


Comments: