29
/
en
AIzaSyAYiBZKx7MnpbEhh9jyipgxe19OcubqV5w
April 1, 2024
99745
Cameroon
CMR
true
2
1
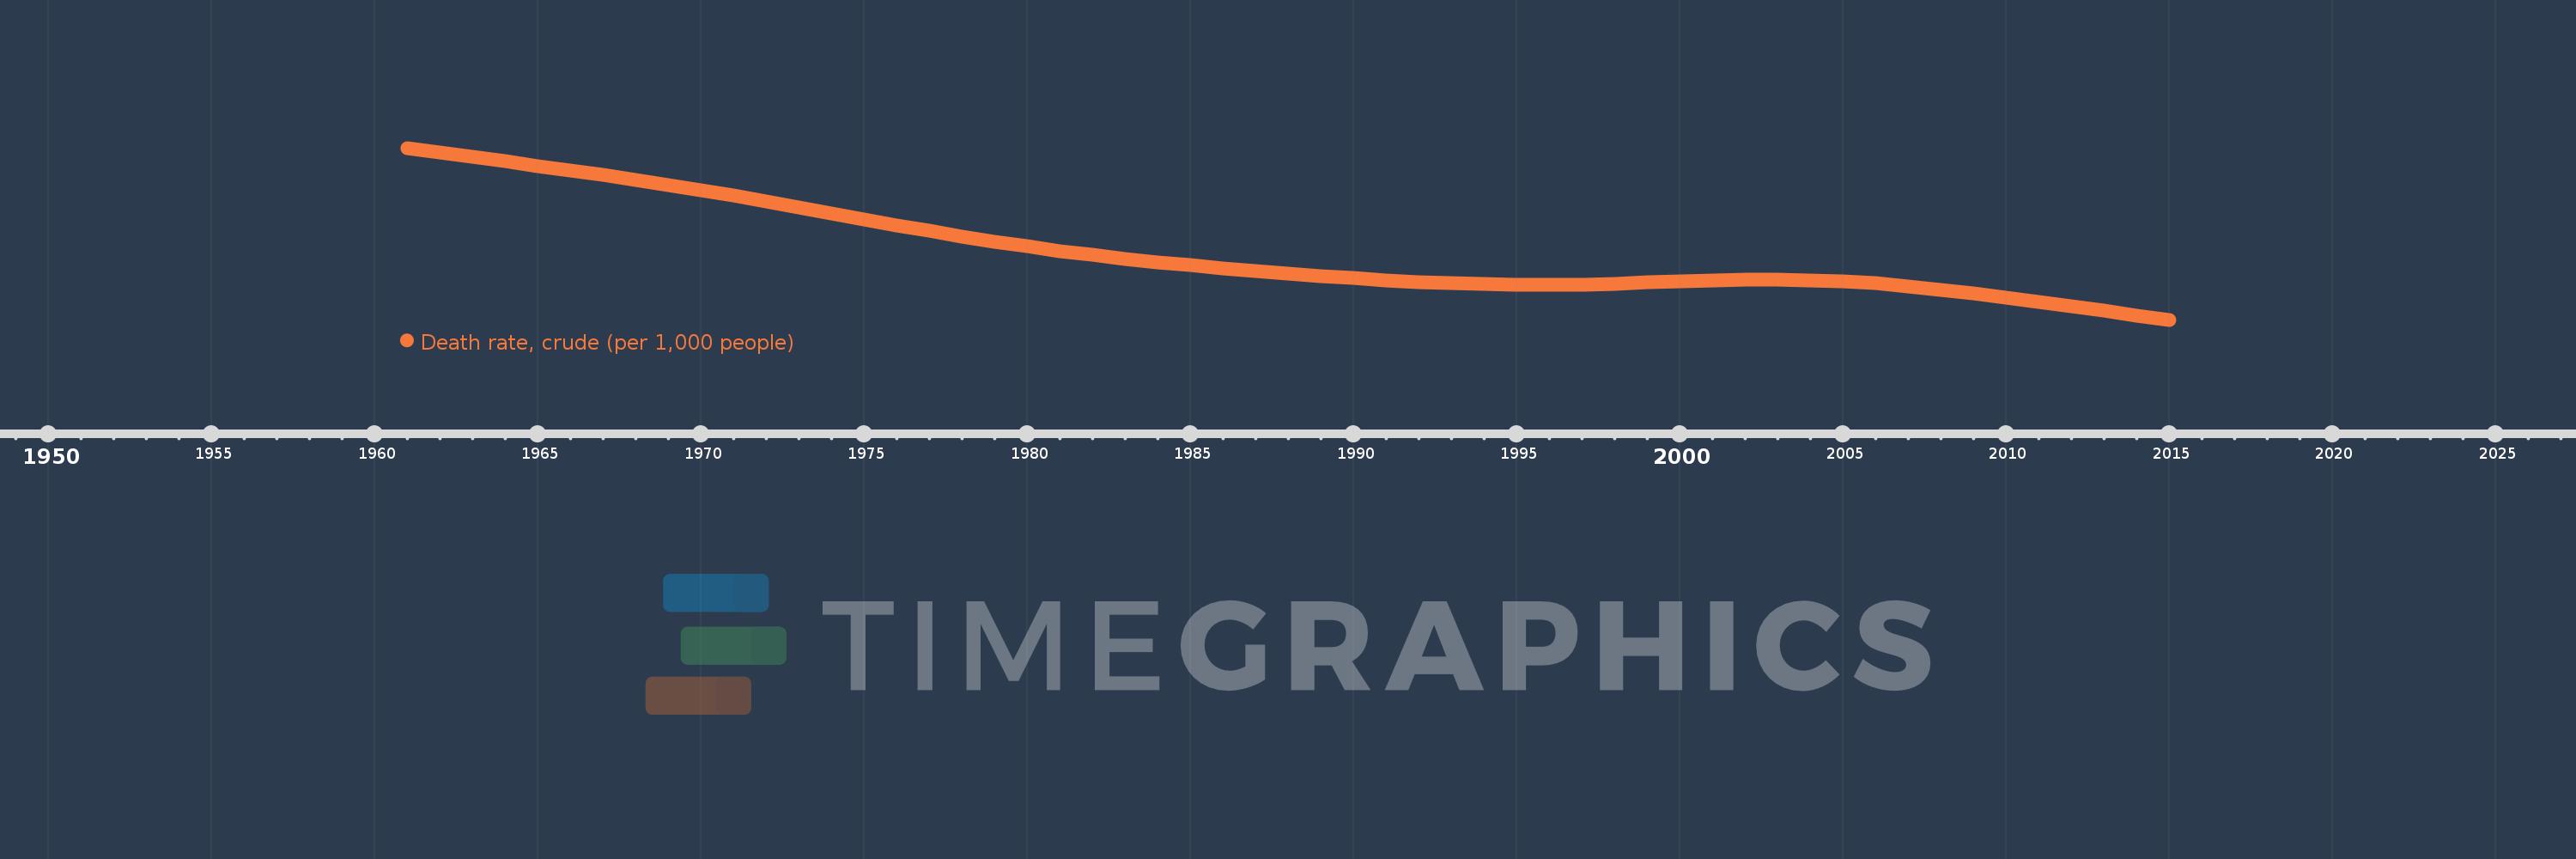
Death rate, crude (per 1,000 people)
2015,2014,2013,2012,2011,2010,2009,2008,2007,2006,2005,2004,2003,2002,2001,2000,1999,1998,1997,1996,1995,1994,1993,1992,1991,1990,1989,1988,1987,1986,1985,1984,1983,1982,1981,1980,1979,1978,1977,1976,1975,1974,1973,1972,1971,1970,1969,1968,1967,1966,1965,1964,1963,1962,1961
This statistics in other country:
AfghanistanAlbaniaAlgeriaAmerican SamoaAndorraAngolaAntigua and BarbudaArab WorldArgentinaArmeniaArubaAustraliaAustriaAzerbaijanBahamas, TheBahrainBangladeshBarbadosBelarusBelgiumBelizeBeninBermudaBhutanBoliviaBosnia and HerzegovinaBotswanaBrazilBrunei DarussalamBulgariaBurkina FasoBurundiCabo VerdeCambodiaCameroonCanadaCaribbean small statesCayman IslandsCentral African RepublicCentral Europe and the BalticsChadChannel IslandsChileChinaColombiaComorosCongo, Dem. Rep.Congo, Rep.Costa RicaCote d'IvoireCroatiaCubaCuracaoCyprusCzech RepublicDenmarkDjiboutiDominicaDominican RepublicEarly-demographic dividendEast Asia & PacificEast Asia & Pacific (excluding high income)East Asia & Pacific (IDA & IBRD countries)EcuadorEgypt, Arab Rep.El SalvadorEquatorial GuineaEritreaEstoniaEthiopiaEuro areaEurope & Central AsiaEurope & Central Asia (excluding high income)Europe & Central Asia (IDA & IBRD countries)European UnionFaroe IslandsFijiFinlandFragile and conflict affected situationsFranceFrench PolynesiaGabonGambia, TheGeorgiaGermanyGhanaGreeceGreenlandGrenadaGuamGuatemalaGuineaGuinea-BissauGuyanaHaitiHeavily indebted poor countries (HIPC)High incomeHondurasHong Kong SAR, ChinaHungaryIBRD onlyIcelandIDA & IBRD totalIDA blendIDA onlyIDA totalIndiaIndonesiaIran, Islamic Rep.IraqIrelandIsle of ManIsraelItalyJamaicaJapanJordanKazakhstanKenyaKiribatiKorea, Dem. People’s Rep.Korea, Rep.KosovoKuwaitKyrgyz RepublicLao PDRLate-demographic dividendLatin America & Caribbean Latin America & Caribbean (excluding high income)Latin America & the Caribbean (IDA & IBRD countries)LatviaLeast developed countries: UN classificationLebanonLesothoLiberiaLibyaLiechtensteinLithuaniaLow & middle incomeLow incomeLower middle incomeLuxembourgMacao SAR, ChinaMacedonia, FYRMadagascarMalawiMalaysiaMaldivesMaliMaltaMarshall IslandsMauritaniaMauritiusMexicoMicronesia, Fed. Sts.Middle East & North AfricaMiddle East & North Africa (excluding high income)Middle East & North Africa (IDA & IBRD countries)Middle incomeMoldovaMonacoMongoliaMontenegroMoroccoMozambiqueMyanmarNamibiaNepalNetherlandsNew CaledoniaNew ZealandNicaraguaNigerNigeriaNorth AmericaNorwayOECD membersOmanOther small statesPacific island small statesPakistanPalauPanamaPapua New GuineaParaguayPeruPhilippinesPolandPortugalPost-demographic dividendPre-demographic dividendPuerto RicoQatarRomaniaRussian FederationRwandaSamoaSan MarinoSao Tome and PrincipeSaudi ArabiaSenegalSerbiaSeychellesSierra LeoneSingaporeSint Maarten (Dutch part)Slovak RepublicSloveniaSmall statesSolomon IslandsSomaliaSouth AfricaSouth AsiaSouth Asia (IDA & IBRD)South SudanSpainSri LankaSt. Kitts and NevisSt. LuciaSt. Martin (French part)St. Vincent and the GrenadinesSub-Saharan Africa Sub-Saharan Africa (excluding high income)Sub-Saharan Africa (IDA & IBRD countries)SudanSurinameSwazilandSwedenSwitzerlandSyrian Arab RepublicTajikistanTanzaniaThailandTimor-LesteTogoTongaTrinidad and TobagoTunisiaTurkeyTurkmenistanUgandaUkraineUnited Arab EmiratesUnited KingdomUnited StatesUpper middle incomeUruguayUzbekistanVanuatuVenezuela, RBVietnamVirgin Islands (U.S.)West Bank and GazaWorldYemen, Rep.ZambiaZimbabwe Timeline:
This timeline shows a graph from 1961 to 2015 of Cameroon. No data until 1960. Number of actual observations by date: 55.
Source name:
World Development Indicators
Source organization:
(1) United Nations Population Division. World Population Prospects, (2) Census reports and other statistical publications from national statistical offices, (3) Eurostat: Demographic Statistics, (4) United Nations Statistical Division. Population and Vital Statistics Reprot (various years), (5) U.S. Census Bureau: International Database, and (6) Secretariat of the Pacific Community: Statistics and Demography Programme.
Categories, topics:
Health
Last updated:
apr 23, 2017
Indicators value changes by year
Minimum:
11.462
jan 1, 2015
Maximum:
22.324
jan 1, 1961
At the date of observation
Value
Absolute change
Change from previous value
jan 1, 1961
22.324
+22.324
0.0%
jan 1, 1962
22.035
-0.289
-1.29%
jan 1, 1963
21.751
-0.284
-1.29%
jan 1, 1964
21.472
-0.279
-1.28%
jan 1, 1965
21.194
-0.278
-1.29%
jan 1, 1966
20.913
-0.281
-1.33%
jan 1, 1967
20.622
-0.291
-1.39%
jan 1, 1968
20.318
-0.304
-1.47%
jan 1, 1969
19.999
-0.319
-1.57%
jan 1, 1970
19.664
-0.335
-1.68%
jan 1, 1971
19.313
-0.351
-1.78%
jan 1, 1972
18.946
-0.367
-1.9%
jan 1, 1973
18.568
-0.378
-2.0%
jan 1, 1974
18.187
-0.381
-2.05%
jan 1, 1975
17.807
-0.38
-2.09%
jan 1, 1976
17.433
-0.374
-2.1%
jan 1, 1977
17.072
-0.361
-2.07%
jan 1, 1978
16.725
-0.347
-2.03%
jan 1, 1979
16.397
-0.328
-1.96%
jan 1, 1980
16.09
-0.307
-1.87%
jan 1, 1981
15.807
-0.283
-1.76%
jan 1, 1982
15.549
-0.258
-1.63%
jan 1, 1983
15.314
-0.235
-1.51%
jan 1, 1984
15.1
-0.214
-1.4%
jan 1, 1985
14.904
-0.196
-1.3%
jan 1, 1986
14.723
-0.181
-1.21%
jan 1, 1987
14.553
-0.17
-1.15%
jan 1, 1988
14.392
-0.161
-1.11%
jan 1, 1989
14.239
-0.153
-1.06%
jan 1, 1990
14.095
-0.144
-1.01%
jan 1, 1991
13.965
-0.13
-0.92%
jan 1, 1992
13.853
-0.112
-0.8%
jan 1, 1993
13.765
-0.088
-0.64%
jan 1, 1994
13.704
-0.061
-0.44%
jan 1, 1995
13.669
-0.035
-0.26%
jan 1, 1996
13.664
-0.005
-0.04%
jan 1, 1997
13.691
+0.027
0.2%
jan 1, 1998
13.744
+0.053
0.39%
jan 1, 1999
13.812
+0.068
0.49%
jan 1, 2000
13.885
+0.073
0.53%
jan 1, 2001
13.95
+0.065
0.47%
jan 1, 2002
13.991
+0.041
0.29%
jan 1, 2003
13.999
+0.008
0.06%
jan 1, 2004
13.966
-0.033
-0.24%
jan 1, 2005
13.886
-0.08
-0.57%
jan 1, 2006
13.758
-0.128
-0.92%
jan 1, 2007
13.58
-0.178
-1.29%
jan 1, 2008
13.366
-0.214
-1.58%
jan 1, 2009
13.124
-0.242
-1.81%
jan 1, 2010
12.862
-0.262
-2.0%
jan 1, 2011
12.587
-0.275
-2.14%
jan 1, 2012
12.306
-0.281
-2.23%
jan 1, 2013
12.021
-0.285
-2.32%
jan 1, 2014
11.739
-0.282
-2.35%
jan 1, 2015
11.462
-0.277
-2.36%
Ranking of countries by current statistics by years


Comments: