29
/
en
AIzaSyAYiBZKx7MnpbEhh9jyipgxe19OcubqV5w
April 1, 2024
28000
East Asia & Pacific (excluding high income)
EAP
false
2
1
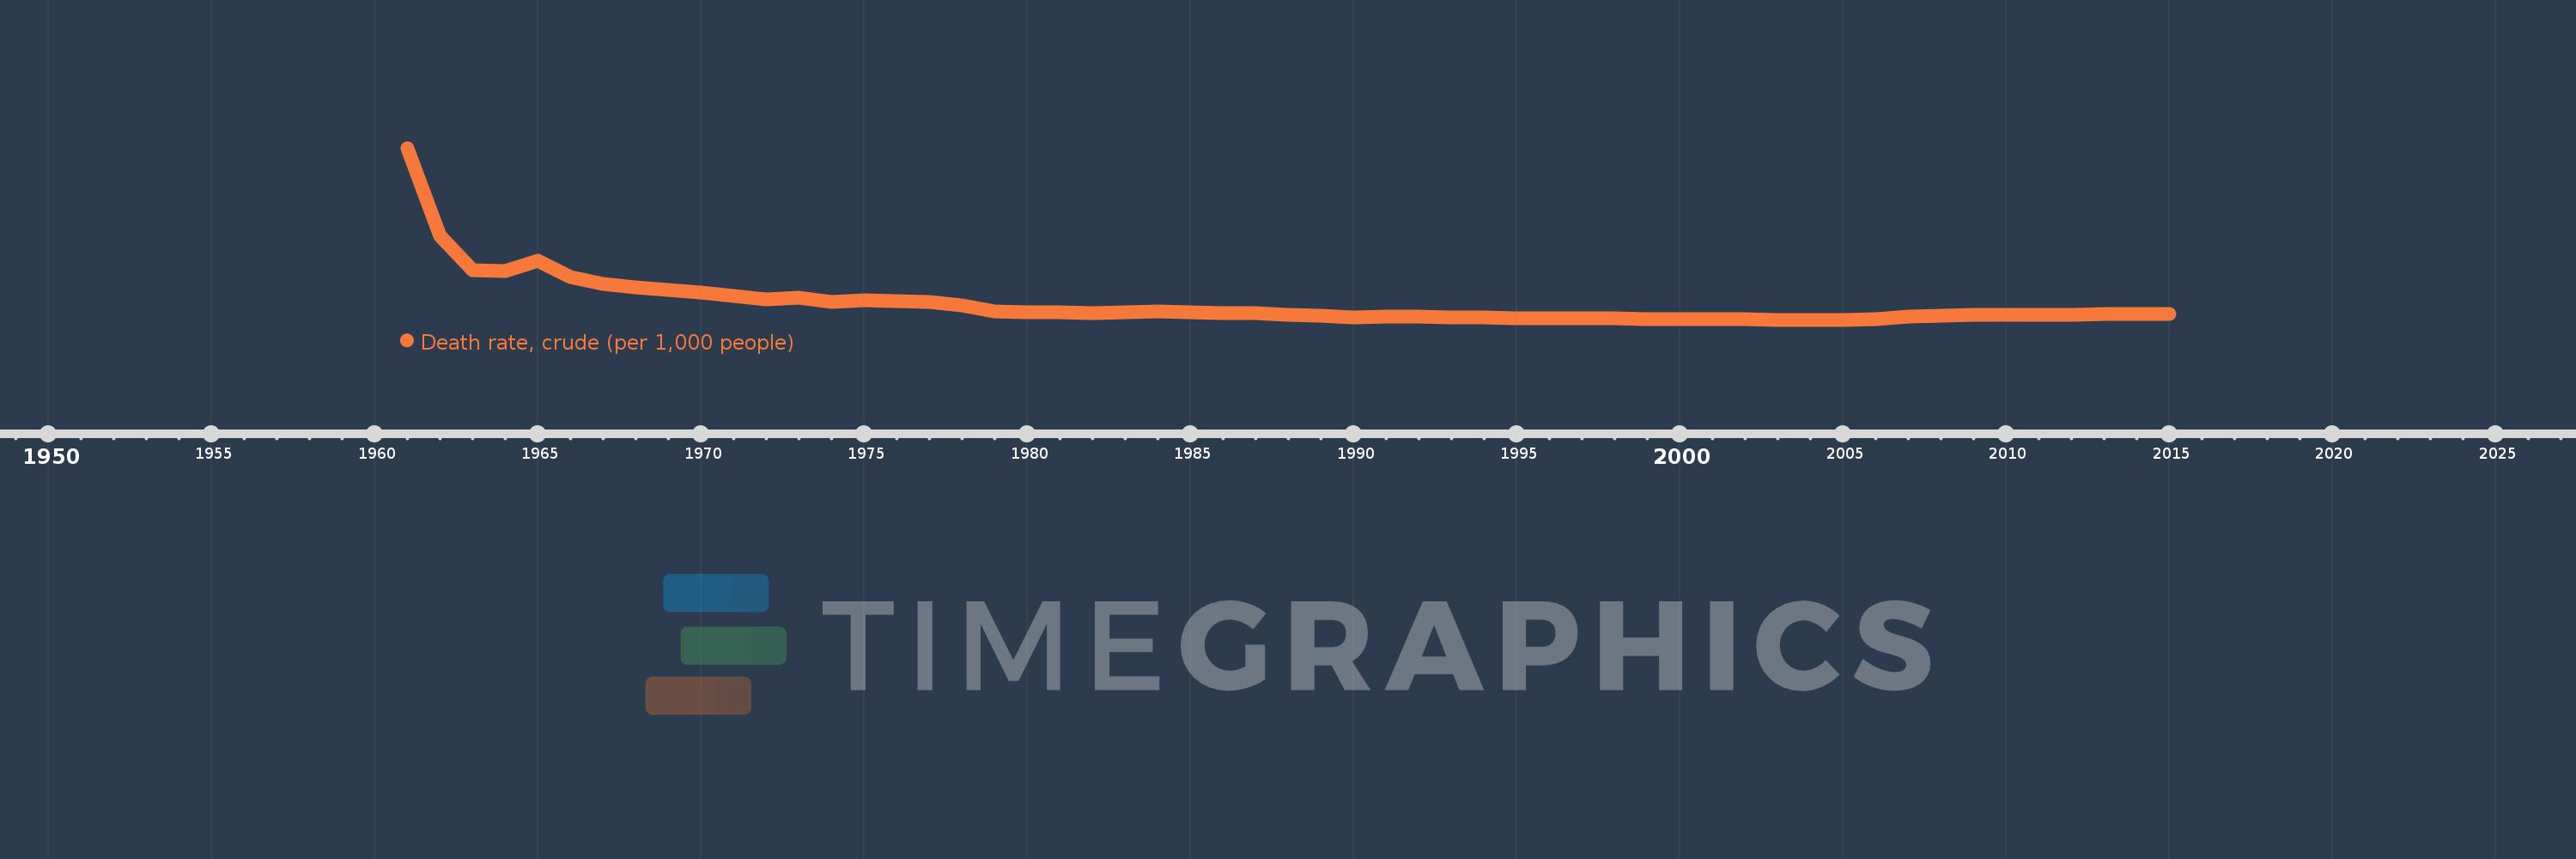
Death rate, crude (per 1,000 people)
2015,2014,2013,2012,2011,2010,2009,2008,2007,2006,2005,2004,2003,2002,2001,2000,1999,1998,1997,1996,1995,1994,1993,1992,1991,1990,1989,1988,1987,1986,1985,1984,1983,1982,1981,1980,1979,1978,1977,1976,1975,1974,1973,1972,1971,1970,1969,1968,1967,1966,1965,1964,1963,1962,1961
This statistics in other country:
AfghanistanAlbaniaAlgeriaAmerican SamoaAndorraAngolaAntigua and BarbudaArab WorldArgentinaArmeniaArubaAustraliaAustriaAzerbaijanBahamas, TheBahrainBangladeshBarbadosBelarusBelgiumBelizeBeninBermudaBhutanBoliviaBosnia and HerzegovinaBotswanaBrazilBrunei DarussalamBulgariaBurkina FasoBurundiCabo VerdeCambodiaCameroonCanadaCaribbean small statesCayman IslandsCentral African RepublicCentral Europe and the BalticsChadChannel IslandsChileChinaColombiaComorosCongo, Dem. Rep.Congo, Rep.Costa RicaCote d'IvoireCroatiaCubaCuracaoCyprusCzech RepublicDenmarkDjiboutiDominicaDominican RepublicEarly-demographic dividendEast Asia & PacificEast Asia & Pacific (excluding high income)East Asia & Pacific (IDA & IBRD countries)EcuadorEgypt, Arab Rep.El SalvadorEquatorial GuineaEritreaEstoniaEthiopiaEuro areaEurope & Central AsiaEurope & Central Asia (excluding high income)Europe & Central Asia (IDA & IBRD countries)European UnionFaroe IslandsFijiFinlandFragile and conflict affected situationsFranceFrench PolynesiaGabonGambia, TheGeorgiaGermanyGhanaGreeceGreenlandGrenadaGuamGuatemalaGuineaGuinea-BissauGuyanaHaitiHeavily indebted poor countries (HIPC)High incomeHondurasHong Kong SAR, ChinaHungaryIBRD onlyIcelandIDA & IBRD totalIDA blendIDA onlyIDA totalIndiaIndonesiaIran, Islamic Rep.IraqIrelandIsle of ManIsraelItalyJamaicaJapanJordanKazakhstanKenyaKiribatiKorea, Dem. People’s Rep.Korea, Rep.KosovoKuwaitKyrgyz RepublicLao PDRLate-demographic dividendLatin America & Caribbean Latin America & Caribbean (excluding high income)Latin America & the Caribbean (IDA & IBRD countries)LatviaLeast developed countries: UN classificationLebanonLesothoLiberiaLibyaLiechtensteinLithuaniaLow & middle incomeLow incomeLower middle incomeLuxembourgMacao SAR, ChinaMacedonia, FYRMadagascarMalawiMalaysiaMaldivesMaliMaltaMarshall IslandsMauritaniaMauritiusMexicoMicronesia, Fed. Sts.Middle East & North AfricaMiddle East & North Africa (excluding high income)Middle East & North Africa (IDA & IBRD countries)Middle incomeMoldovaMonacoMongoliaMontenegroMoroccoMozambiqueMyanmarNamibiaNepalNetherlandsNew CaledoniaNew ZealandNicaraguaNigerNigeriaNorth AmericaNorwayOECD membersOmanOther small statesPacific island small statesPakistanPalauPanamaPapua New GuineaParaguayPeruPhilippinesPolandPortugalPost-demographic dividendPre-demographic dividendPuerto RicoQatarRomaniaRussian FederationRwandaSamoaSan MarinoSao Tome and PrincipeSaudi ArabiaSenegalSerbiaSeychellesSierra LeoneSingaporeSint Maarten (Dutch part)Slovak RepublicSloveniaSmall statesSolomon IslandsSomaliaSouth AfricaSouth AsiaSouth Asia (IDA & IBRD)South SudanSpainSri LankaSt. Kitts and NevisSt. LuciaSt. Martin (French part)St. Vincent and the GrenadinesSub-Saharan Africa Sub-Saharan Africa (excluding high income)Sub-Saharan Africa (IDA & IBRD countries)SudanSurinameSwazilandSwedenSwitzerlandSyrian Arab RepublicTajikistanTanzaniaThailandTimor-LesteTogoTongaTrinidad and TobagoTunisiaTurkeyTurkmenistanUgandaUkraineUnited Arab EmiratesUnited KingdomUnited StatesUpper middle incomeUruguayUzbekistanVanuatuVenezuela, RBVietnamVirgin Islands (U.S.)West Bank and GazaWorldYemen, Rep.ZambiaZimbabwe Timeline:
This timeline shows a graph from 1961 to 2015 of East Asia & Pacific (excluding high income). No data until 1960. Number of actual observations by date: 55.
Source name:
World Development Indicators
Source organization:
(1) United Nations Population Division. World Population Prospects, (2) Census reports and other statistical publications from national statistical offices, (3) Eurostat: Demographic Statistics, (4) United Nations Statistical Division. Population and Vital Statistics Reprot (various years), (5) U.S. Census Bureau: International Database, and (6) Secretariat of the Pacific Community: Statistics and Demography Programme.
Categories, topics:
Health
Last updated:
apr 23, 2017
Indicators value changes by year
Maximum:
22.974
jan 1, 1961
At the date of observation
Value
Absolute change
Change from previous value
jan 1, 1961
22.974
+22.974
0.0%
jan 1, 1962
14.545
-8.428
-36.69%
jan 1, 1963
11.339
-3.206
-22.04%
jan 1, 1964
11.241
-0.098
-0.87%
jan 1, 1965
12.2
+0.959
8.53%
jan 1, 1966
10.626
-1.574
-12.9%
jan 1, 1967
10.03
-0.596
-5.61%
jan 1, 1968
9.642
-0.388
-3.87%
jan 1, 1969
9.396
-0.246
-2.56%
jan 1, 1970
9.188
-0.208
-2.21%
jan 1, 1971
8.807
-0.381
-4.15%
jan 1, 1972
8.546
-0.26
-2.96%
jan 1, 1973
8.714
+0.168
1.96%
jan 1, 1974
8.256
-0.458
-5.25%
jan 1, 1975
8.436
+0.18
2.17%
jan 1, 1976
8.374
-0.062
-0.73%
jan 1, 1977
8.262
-0.113
-1.34%
jan 1, 1978
7.908
-0.354
-4.28%
jan 1, 1979
7.369
-0.539
-6.82%
jan 1, 1980
7.246
-0.123
-1.67%
jan 1, 1981
7.246
+0.0
0.01%
jan 1, 1982
7.17
-0.076
-1.04%
jan 1, 1983
7.257
+0.087
1.21%
jan 1, 1984
7.394
+0.136
1.88%
jan 1, 1985
7.266
-0.128
-1.73%
jan 1, 1986
7.176
-0.09
-1.24%
jan 1, 1987
7.18
+0.004
0.06%
jan 1, 1988
7.034
-0.145
-2.02%
jan 1, 1989
6.937
-0.097
-1.38%
jan 1, 1990
6.831
-0.106
-1.53%
jan 1, 1991
6.893
+0.062
0.91%
jan 1, 1992
6.889
-0.004
-0.06%
jan 1, 1993
6.826
-0.063
-0.92%
jan 1, 1994
6.81
-0.016
-0.24%
jan 1, 1995
6.691
-0.118
-1.74%
jan 1, 1996
6.738
+0.046
0.69%
jan 1, 1997
6.722
-0.015
-0.22%
jan 1, 1998
6.681
-0.041
-0.62%
jan 1, 1999
6.669
-0.013
-0.19%
jan 1, 2000
6.636
-0.033
-0.49%
jan 1, 2001
6.624
-0.012
-0.18%
jan 1, 2002
6.605
-0.019
-0.29%
jan 1, 2003
6.585
-0.019
-0.29%
jan 1, 2004
6.573
-0.012
-0.19%
jan 1, 2005
6.582
+0.009
0.13%
jan 1, 2006
6.639
+0.058
0.87%
jan 1, 2007
6.842
+0.203
3.05%
jan 1, 2008
6.922
+0.081
1.18%
jan 1, 2009
7.012
+0.089
1.29%
jan 1, 2010
7.028
+0.016
0.23%
jan 1, 2011
7.053
+0.025
0.36%
jan 1, 2012
7.08
+0.026
0.37%
jan 1, 2013
7.093
+0.014
0.19%
jan 1, 2014
7.108
+0.014
0.2%
jan 1, 2015
7.142
+0.035
0.49%
Ranking of countries by current statistics by years


Comments: