29
/
en
AIzaSyAYiBZKx7MnpbEhh9jyipgxe19OcubqV5w
April 1, 2024
54676
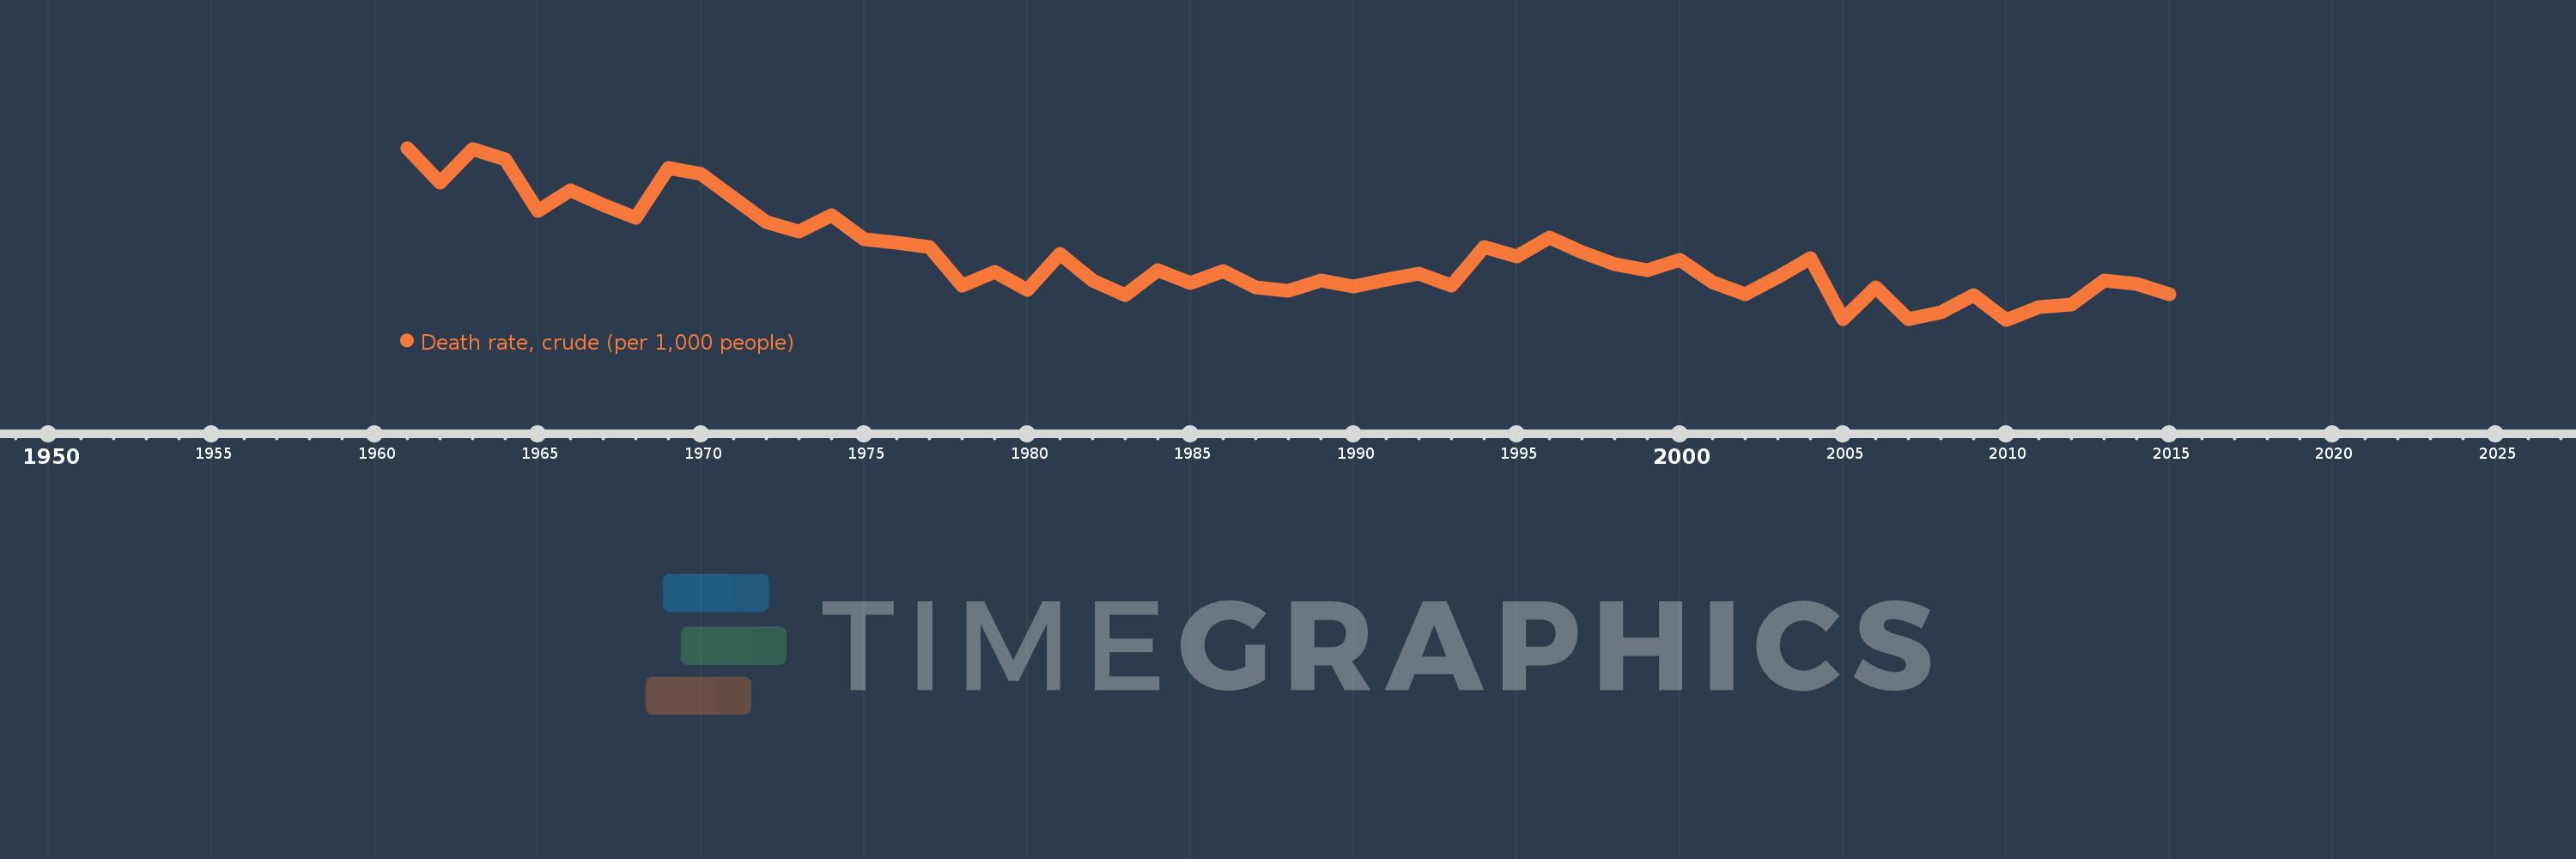
Post-demographic dividend
PST
false
2
1
Death rate, crude (per 1,000 people)
2015,2014,2013,2012,2011,2010,2009,2008,2007,2006,2005,2004,2003,2002,2001,2000,1999,1998,1997,1996,1995,1994,1993,1992,1991,1990,1989,1988,1987,1986,1985,1984,1983,1982,1981,1980,1979,1978,1977,1976,1975,1974,1973,1972,1971,1970,1969,1968,1967,1966,1965,1964,1963,1962,1961
This statistics in other country:
AfghanistanAlbaniaAlgeriaAmerican SamoaAndorraAngolaAntigua and BarbudaArab WorldArgentinaArmeniaArubaAustraliaAustriaAzerbaijanBahamas, TheBahrainBangladeshBarbadosBelarusBelgiumBelizeBeninBermudaBhutanBoliviaBosnia and HerzegovinaBotswanaBrazilBrunei DarussalamBulgariaBurkina FasoBurundiCabo VerdeCambodiaCameroonCanadaCaribbean small statesCayman IslandsCentral African RepublicCentral Europe and the BalticsChadChannel IslandsChileChinaColombiaComorosCongo, Dem. Rep.Congo, Rep.Costa RicaCote d'IvoireCroatiaCubaCuracaoCyprusCzech RepublicDenmarkDjiboutiDominicaDominican RepublicEarly-demographic dividendEast Asia & PacificEast Asia & Pacific (excluding high income)East Asia & Pacific (IDA & IBRD countries)EcuadorEgypt, Arab Rep.El SalvadorEquatorial GuineaEritreaEstoniaEthiopiaEuro areaEurope & Central AsiaEurope & Central Asia (excluding high income)Europe & Central Asia (IDA & IBRD countries)European UnionFaroe IslandsFijiFinlandFragile and conflict affected situationsFranceFrench PolynesiaGabonGambia, TheGeorgiaGermanyGhanaGreeceGreenlandGrenadaGuamGuatemalaGuineaGuinea-BissauGuyanaHaitiHeavily indebted poor countries (HIPC)High incomeHondurasHong Kong SAR, ChinaHungaryIBRD onlyIcelandIDA & IBRD totalIDA blendIDA onlyIDA totalIndiaIndonesiaIran, Islamic Rep.IraqIrelandIsle of ManIsraelItalyJamaicaJapanJordanKazakhstanKenyaKiribatiKorea, Dem. People’s Rep.Korea, Rep.KosovoKuwaitKyrgyz RepublicLao PDRLate-demographic dividendLatin America & Caribbean Latin America & Caribbean (excluding high income)Latin America & the Caribbean (IDA & IBRD countries)LatviaLeast developed countries: UN classificationLebanonLesothoLiberiaLibyaLiechtensteinLithuaniaLow & middle incomeLow incomeLower middle incomeLuxembourgMacao SAR, ChinaMacedonia, FYRMadagascarMalawiMalaysiaMaldivesMaliMaltaMarshall IslandsMauritaniaMauritiusMexicoMicronesia, Fed. Sts.Middle East & North AfricaMiddle East & North Africa (excluding high income)Middle East & North Africa (IDA & IBRD countries)Middle incomeMoldovaMonacoMongoliaMontenegroMoroccoMozambiqueMyanmarNamibiaNepalNetherlandsNew CaledoniaNew ZealandNicaraguaNigerNigeriaNorth AmericaNorwayOECD membersOmanOther small statesPacific island small statesPakistanPalauPanamaPapua New GuineaParaguayPeruPhilippinesPolandPortugalPost-demographic dividendPre-demographic dividendPuerto RicoQatarRomaniaRussian FederationRwandaSamoaSan MarinoSao Tome and PrincipeSaudi ArabiaSenegalSerbiaSeychellesSierra LeoneSingaporeSint Maarten (Dutch part)Slovak RepublicSloveniaSmall statesSolomon IslandsSomaliaSouth AfricaSouth AsiaSouth Asia (IDA & IBRD)South SudanSpainSri LankaSt. Kitts and NevisSt. LuciaSt. Martin (French part)St. Vincent and the GrenadinesSub-Saharan Africa Sub-Saharan Africa (excluding high income)Sub-Saharan Africa (IDA & IBRD countries)SudanSurinameSwazilandSwedenSwitzerlandSyrian Arab RepublicTajikistanTanzaniaThailandTimor-LesteTogoTongaTrinidad and TobagoTunisiaTurkeyTurkmenistanUgandaUkraineUnited Arab EmiratesUnited KingdomUnited StatesUpper middle incomeUruguayUzbekistanVanuatuVenezuela, RBVietnamVirgin Islands (U.S.)West Bank and GazaWorldYemen, Rep.ZambiaZimbabwe Timeline:
This timeline shows a graph from 1961 to 2015 of Post-demographic dividend. No data until 1960. Number of actual observations by date: 55.
Source name:
World Development Indicators
Source organization:
(1) United Nations Population Division. World Population Prospects, (2) Census reports and other statistical publications from national statistical offices, (3) Eurostat: Demographic Statistics, (4) United Nations Statistical Division. Population and Vital Statistics Reprot (various years), (5) U.S. Census Bureau: International Database, and (6) Secretariat of the Pacific Community: Statistics and Demography Programme.
Categories, topics:
Health
Last updated:
apr 23, 2017
Indicators value changes by year
At the date of observation
Value
Absolute change
Change from previous value
jan 1, 1961
9.797
+9.797
0.0%
jan 1, 1962
9.612
-0.185
-1.88%
jan 1, 1963
9.793
+0.181
1.89%
jan 1, 1964
9.737
-0.056
-0.57%
jan 1, 1965
9.463
-0.274
-2.81%
jan 1, 1966
9.573
+0.109
1.15%
jan 1, 1967
9.494
-0.078
-0.82%
jan 1, 1968
9.424
-0.071
-0.74%
jan 1, 1969
9.688
+0.264
2.8%
jan 1, 1970
9.657
-0.031
-0.32%
jan 1, 1971
9.531
-0.126
-1.31%
jan 1, 1972
9.402
-0.128
-1.35%
jan 1, 1973
9.353
-0.05
-0.53%
jan 1, 1974
9.44
+0.088
0.94%
jan 1, 1975
9.31
-0.13
-1.38%
jan 1, 1976
9.292
-0.018
-0.2%
jan 1, 1977
9.269
-0.022
-0.24%
jan 1, 1978
9.062
-0.208
-2.24%
jan 1, 1979
9.135
+0.073
0.8%
jan 1, 1980
9.04
-0.095
-1.04%
jan 1, 1981
9.231
+0.191
2.11%
jan 1, 1982
9.088
-0.143
-1.55%
jan 1, 1983
9.01
-0.078
-0.86%
jan 1, 1984
9.143
+0.134
1.48%
jan 1, 1985
9.077
-0.067
-0.73%
jan 1, 1986
9.138
+0.062
0.68%
jan 1, 1987
9.054
-0.084
-0.92%
jan 1, 1988
9.036
-0.018
-0.2%
jan 1, 1989
9.09
+0.054
0.6%
jan 1, 1990
9.058
-0.032
-0.35%
jan 1, 1991
9.093
+0.035
0.39%
jan 1, 1992
9.125
+0.031
0.34%
jan 1, 1993
9.064
-0.061
-0.67%
jan 1, 1994
9.269
+0.205
2.26%
jan 1, 1995
9.218
-0.051
-0.55%
jan 1, 1996
9.319
+0.101
1.09%
jan 1, 1997
9.243
-0.076
-0.81%
jan 1, 1998
9.176
-0.067
-0.72%
jan 1, 1999
9.146
-0.03
-0.33%
jan 1, 2000
9.201
+0.055
0.6%
jan 1, 2001
9.081
-0.121
-1.31%
jan 1, 2002
9.015
-0.065
-0.72%
jan 1, 2003
9.106
+0.091
1.01%
jan 1, 2004
9.209
+0.103
1.13%
jan 1, 2005
8.885
-0.324
-3.51%
jan 1, 2006
9.054
+0.169
1.9%
jan 1, 2007
8.882
-0.172
-1.9%
jan 1, 2008
8.918
+0.036
0.4%
jan 1, 2009
9.01
+0.092
1.04%
jan 1, 2010
8.88
-0.131
-1.45%
jan 1, 2011
8.948
+0.068
0.77%
jan 1, 2012
8.96
+0.012
0.13%
jan 1, 2013
9.091
+0.131
1.46%
jan 1, 2014
9.071
-0.02
-0.21%
jan 1, 2015
9.015
-0.056
-0.62%
Ranking of countries by current statistics by years


Comments: