29
/
en
AIzaSyAYiBZKx7MnpbEhh9jyipgxe19OcubqV5w
April 1, 2024
227270
Qatar
QAT
true
2
1
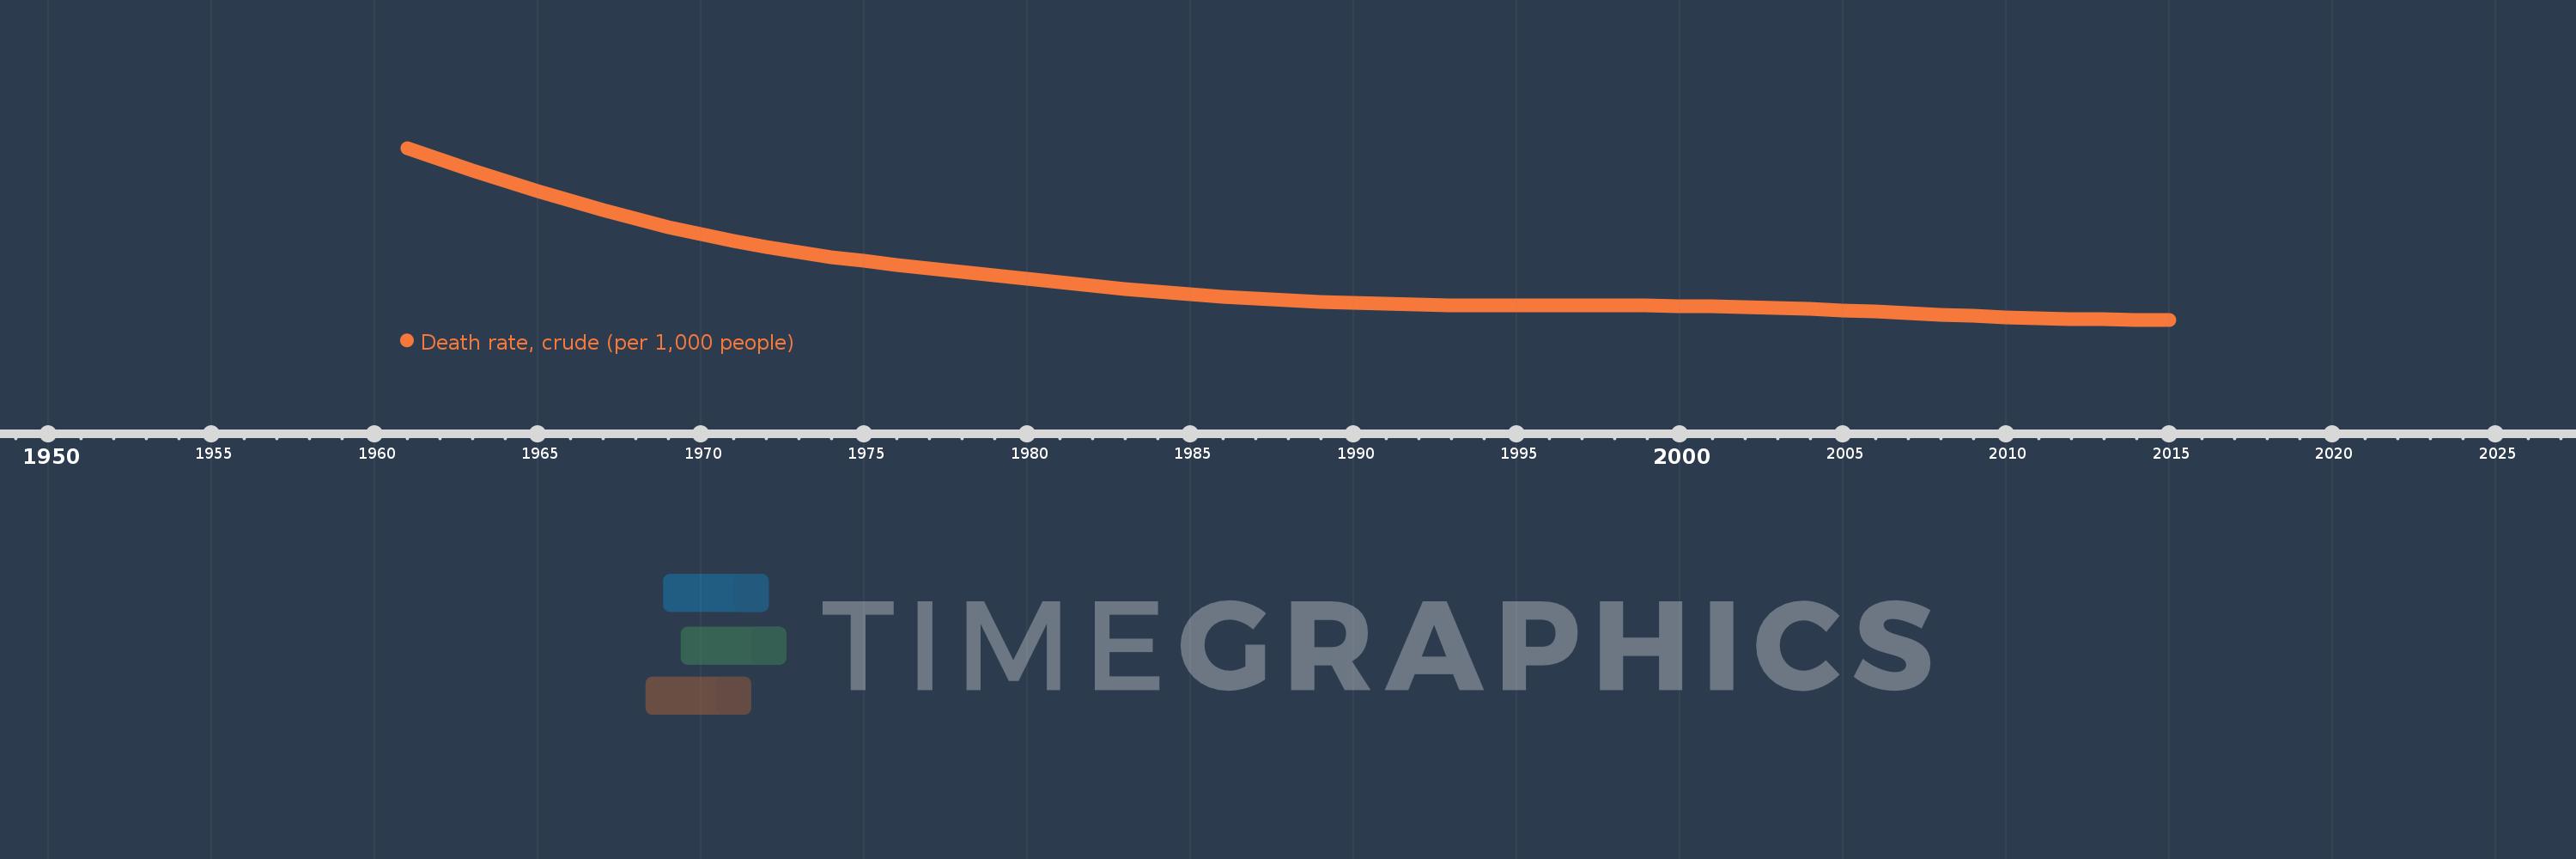
Death rate, crude (per 1,000 people)
2015,2014,2013,2012,2011,2010,2009,2008,2007,2006,2005,2004,2003,2002,2001,2000,1999,1998,1997,1996,1995,1994,1993,1992,1991,1990,1989,1988,1987,1986,1985,1984,1983,1982,1981,1980,1979,1978,1977,1976,1975,1974,1973,1972,1971,1970,1969,1968,1967,1966,1965,1964,1963,1962,1961
This statistics in other country:
AfghanistanAlbaniaAlgeriaAmerican SamoaAndorraAngolaAntigua and BarbudaArab WorldArgentinaArmeniaArubaAustraliaAustriaAzerbaijanBahamas, TheBahrainBangladeshBarbadosBelarusBelgiumBelizeBeninBermudaBhutanBoliviaBosnia and HerzegovinaBotswanaBrazilBrunei DarussalamBulgariaBurkina FasoBurundiCabo VerdeCambodiaCameroonCanadaCaribbean small statesCayman IslandsCentral African RepublicCentral Europe and the BalticsChadChannel IslandsChileChinaColombiaComorosCongo, Dem. Rep.Congo, Rep.Costa RicaCote d'IvoireCroatiaCubaCuracaoCyprusCzech RepublicDenmarkDjiboutiDominicaDominican RepublicEarly-demographic dividendEast Asia & PacificEast Asia & Pacific (excluding high income)East Asia & Pacific (IDA & IBRD countries)EcuadorEgypt, Arab Rep.El SalvadorEquatorial GuineaEritreaEstoniaEthiopiaEuro areaEurope & Central AsiaEurope & Central Asia (excluding high income)Europe & Central Asia (IDA & IBRD countries)European UnionFaroe IslandsFijiFinlandFragile and conflict affected situationsFranceFrench PolynesiaGabonGambia, TheGeorgiaGermanyGhanaGreeceGreenlandGrenadaGuamGuatemalaGuineaGuinea-BissauGuyanaHaitiHeavily indebted poor countries (HIPC)High incomeHondurasHong Kong SAR, ChinaHungaryIBRD onlyIcelandIDA & IBRD totalIDA blendIDA onlyIDA totalIndiaIndonesiaIran, Islamic Rep.IraqIrelandIsle of ManIsraelItalyJamaicaJapanJordanKazakhstanKenyaKiribatiKorea, Dem. People’s Rep.Korea, Rep.KosovoKuwaitKyrgyz RepublicLao PDRLate-demographic dividendLatin America & Caribbean Latin America & Caribbean (excluding high income)Latin America & the Caribbean (IDA & IBRD countries)LatviaLeast developed countries: UN classificationLebanonLesothoLiberiaLibyaLiechtensteinLithuaniaLow & middle incomeLow incomeLower middle incomeLuxembourgMacao SAR, ChinaMacedonia, FYRMadagascarMalawiMalaysiaMaldivesMaliMaltaMarshall IslandsMauritaniaMauritiusMexicoMicronesia, Fed. Sts.Middle East & North AfricaMiddle East & North Africa (excluding high income)Middle East & North Africa (IDA & IBRD countries)Middle incomeMoldovaMonacoMongoliaMontenegroMoroccoMozambiqueMyanmarNamibiaNepalNetherlandsNew CaledoniaNew ZealandNicaraguaNigerNigeriaNorth AmericaNorwayOECD membersOmanOther small statesPacific island small statesPakistanPalauPanamaPapua New GuineaParaguayPeruPhilippinesPolandPortugalPost-demographic dividendPre-demographic dividendPuerto RicoQatarRomaniaRussian FederationRwandaSamoaSan MarinoSao Tome and PrincipeSaudi ArabiaSenegalSerbiaSeychellesSierra LeoneSingaporeSint Maarten (Dutch part)Slovak RepublicSloveniaSmall statesSolomon IslandsSomaliaSouth AfricaSouth AsiaSouth Asia (IDA & IBRD)South SudanSpainSri LankaSt. Kitts and NevisSt. LuciaSt. Martin (French part)St. Vincent and the GrenadinesSub-Saharan Africa Sub-Saharan Africa (excluding high income)Sub-Saharan Africa (IDA & IBRD countries)SudanSurinameSwazilandSwedenSwitzerlandSyrian Arab RepublicTajikistanTanzaniaThailandTimor-LesteTogoTongaTrinidad and TobagoTunisiaTurkeyTurkmenistanUgandaUkraineUnited Arab EmiratesUnited KingdomUnited StatesUpper middle incomeUruguayUzbekistanVanuatuVenezuela, RBVietnamVirgin Islands (U.S.)West Bank and GazaWorldYemen, Rep.ZambiaZimbabwe Timeline:
This timeline shows a graph from 1961 to 2015 of Qatar. No data until 1960. Number of actual observations by date: 55.
Source name:
World Development Indicators
Source organization:
(1) United Nations Population Division. World Population Prospects, (2) Census reports and other statistical publications from national statistical offices, (3) Eurostat: Demographic Statistics, (4) United Nations Statistical Division. Population and Vital Statistics Reprot (various years), (5) U.S. Census Bureau: International Database, and (6) Secretariat of the Pacific Community: Statistics and Demography Programme.
Categories, topics:
Health
Last updated:
apr 23, 2017
Indicators value changes by year
At the date of observation
Value
Absolute change
Change from previous value
jan 1, 1961
9.279
+9.279
0.0%
jan 1, 1962
8.769
-0.51
-5.5%
jan 1, 1963
8.27
-0.499
-5.69%
jan 1, 1964
7.785
-0.485
-5.86%
jan 1, 1965
7.318
-0.467
-6.0%
jan 1, 1966
6.872
-0.446
-6.09%
jan 1, 1967
6.451
-0.421
-6.13%
jan 1, 1968
6.057
-0.394
-6.11%
jan 1, 1969
5.692
-0.365
-6.03%
jan 1, 1970
5.358
-0.334
-5.87%
jan 1, 1971
5.055
-0.303
-5.66%
jan 1, 1972
4.785
-0.27
-5.34%
jan 1, 1973
4.545
-0.24
-5.02%
jan 1, 1974
4.332
-0.213
-4.69%
jan 1, 1975
4.141
-0.191
-4.41%
jan 1, 1976
3.966
-0.175
-4.23%
jan 1, 1977
3.801
-0.165
-4.16%
jan 1, 1978
3.642
-0.159
-4.18%
jan 1, 1979
3.486
-0.156
-4.28%
jan 1, 1980
3.331
-0.155
-4.45%
jan 1, 1981
3.177
-0.154
-4.62%
jan 1, 1982
3.025
-0.152
-4.78%
jan 1, 1983
2.881
-0.144
-4.76%
jan 1, 1984
2.747
-0.134
-4.65%
jan 1, 1985
2.626
-0.121
-4.4%
jan 1, 1986
2.518
-0.108
-4.11%
jan 1, 1987
2.427
-0.091
-3.61%
jan 1, 1988
2.349
-0.078
-3.21%
jan 1, 1989
2.285
-0.064
-2.72%
jan 1, 1990
2.234
-0.051
-2.23%
jan 1, 1991
2.194
-0.04
-1.79%
jan 1, 1992
2.166
-0.028
-1.28%
jan 1, 1993
2.148
-0.018
-0.83%
jan 1, 1994
2.137
-0.011
-0.51%
jan 1, 1995
2.131
-0.006
-0.28%
jan 1, 1996
2.128
-0.003
-0.14%
jan 1, 1997
2.124
-0.004
-0.19%
jan 1, 1998
2.12
-0.004
-0.19%
jan 1, 1999
2.113
-0.007
-0.33%
jan 1, 2000
2.101
-0.012
-0.57%
jan 1, 2001
2.081
-0.02
-0.95%
jan 1, 2002
2.051
-0.03
-1.44%
jan 1, 2003
2.01
-0.041
-2.0%
jan 1, 2004
1.961
-0.049
-2.44%
jan 1, 2005
1.904
-0.057
-2.91%
jan 1, 2006
1.842
-0.062
-3.26%
jan 1, 2007
1.776
-0.066
-3.58%
jan 1, 2008
1.712
-0.064
-3.6%
jan 1, 2009
1.651
-0.061
-3.56%
jan 1, 2010
1.598
-0.053
-3.21%
jan 1, 2011
1.554
-0.044
-2.75%
jan 1, 2012
1.52
-0.034
-2.19%
jan 1, 2013
1.497
-0.023
-1.51%
jan 1, 2014
1.484
-0.013
-0.87%
jan 1, 2015
1.48
-0.004
-0.27%
Ranking of countries by current statistics by years


Comments: