29
/
en
AIzaSyAYiBZKx7MnpbEhh9jyipgxe19OcubqV5w
April 1, 2024
57976
South Asia (IDA & IBRD)
TSA
false
2
1
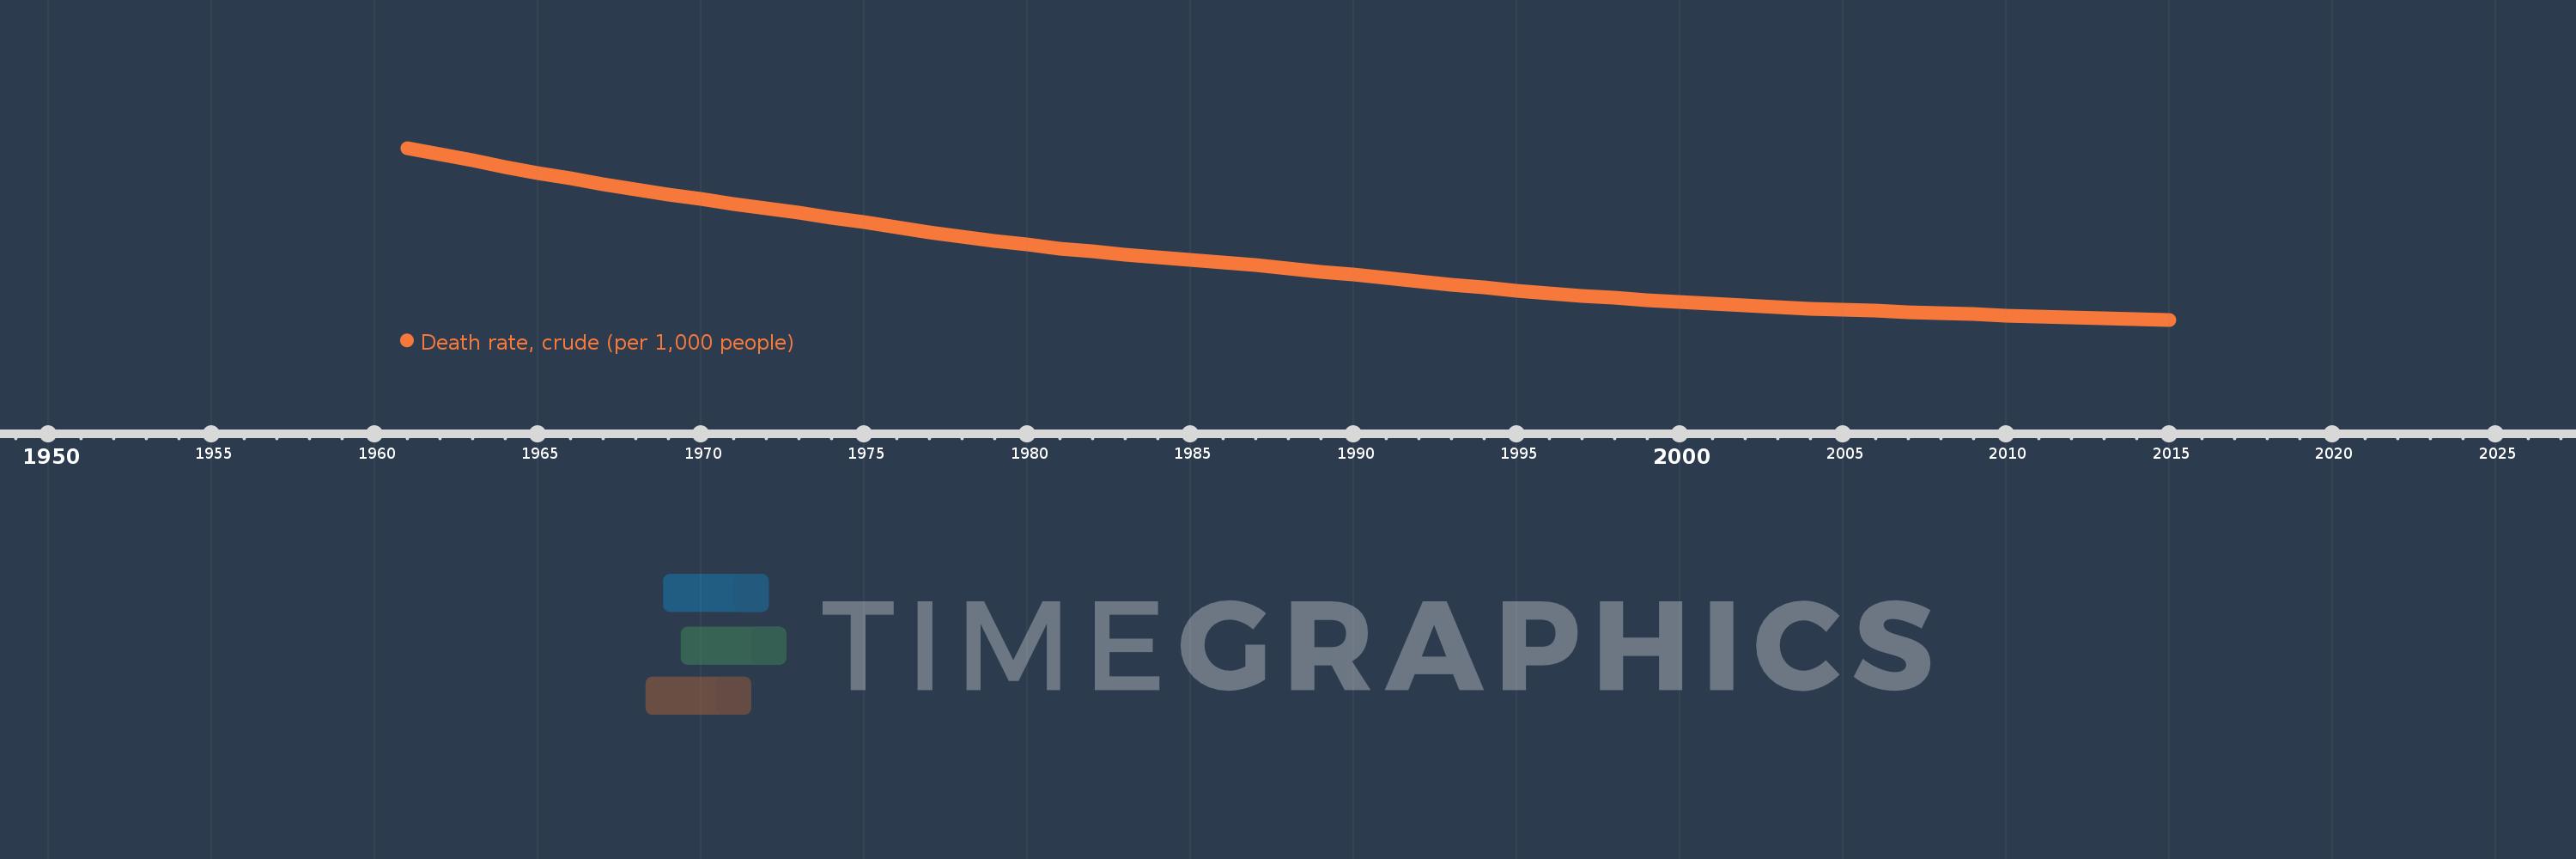
Death rate, crude (per 1,000 people)
2015,2014,2013,2012,2011,2010,2009,2008,2007,2006,2005,2004,2003,2002,2001,2000,1999,1998,1997,1996,1995,1994,1993,1992,1991,1990,1989,1988,1987,1986,1985,1984,1983,1982,1981,1980,1979,1978,1977,1976,1975,1974,1973,1972,1971,1970,1969,1968,1967,1966,1965,1964,1963,1962,1961
This statistics in other country:
AfghanistanAlbaniaAlgeriaAmerican SamoaAndorraAngolaAntigua and BarbudaArab WorldArgentinaArmeniaArubaAustraliaAustriaAzerbaijanBahamas, TheBahrainBangladeshBarbadosBelarusBelgiumBelizeBeninBermudaBhutanBoliviaBosnia and HerzegovinaBotswanaBrazilBrunei DarussalamBulgariaBurkina FasoBurundiCabo VerdeCambodiaCameroonCanadaCaribbean small statesCayman IslandsCentral African RepublicCentral Europe and the BalticsChadChannel IslandsChileChinaColombiaComorosCongo, Dem. Rep.Congo, Rep.Costa RicaCote d'IvoireCroatiaCubaCuracaoCyprusCzech RepublicDenmarkDjiboutiDominicaDominican RepublicEarly-demographic dividendEast Asia & PacificEast Asia & Pacific (excluding high income)East Asia & Pacific (IDA & IBRD countries)EcuadorEgypt, Arab Rep.El SalvadorEquatorial GuineaEritreaEstoniaEthiopiaEuro areaEurope & Central AsiaEurope & Central Asia (excluding high income)Europe & Central Asia (IDA & IBRD countries)European UnionFaroe IslandsFijiFinlandFragile and conflict affected situationsFranceFrench PolynesiaGabonGambia, TheGeorgiaGermanyGhanaGreeceGreenlandGrenadaGuamGuatemalaGuineaGuinea-BissauGuyanaHaitiHeavily indebted poor countries (HIPC)High incomeHondurasHong Kong SAR, ChinaHungaryIBRD onlyIcelandIDA & IBRD totalIDA blendIDA onlyIDA totalIndiaIndonesiaIran, Islamic Rep.IraqIrelandIsle of ManIsraelItalyJamaicaJapanJordanKazakhstanKenyaKiribatiKorea, Dem. People’s Rep.Korea, Rep.KosovoKuwaitKyrgyz RepublicLao PDRLate-demographic dividendLatin America & Caribbean Latin America & Caribbean (excluding high income)Latin America & the Caribbean (IDA & IBRD countries)LatviaLeast developed countries: UN classificationLebanonLesothoLiberiaLibyaLiechtensteinLithuaniaLow & middle incomeLow incomeLower middle incomeLuxembourgMacao SAR, ChinaMacedonia, FYRMadagascarMalawiMalaysiaMaldivesMaliMaltaMarshall IslandsMauritaniaMauritiusMexicoMicronesia, Fed. Sts.Middle East & North AfricaMiddle East & North Africa (excluding high income)Middle East & North Africa (IDA & IBRD countries)Middle incomeMoldovaMonacoMongoliaMontenegroMoroccoMozambiqueMyanmarNamibiaNepalNetherlandsNew CaledoniaNew ZealandNicaraguaNigerNigeriaNorth AmericaNorwayOECD membersOmanOther small statesPacific island small statesPakistanPalauPanamaPapua New GuineaParaguayPeruPhilippinesPolandPortugalPost-demographic dividendPre-demographic dividendPuerto RicoQatarRomaniaRussian FederationRwandaSamoaSan MarinoSao Tome and PrincipeSaudi ArabiaSenegalSerbiaSeychellesSierra LeoneSingaporeSint Maarten (Dutch part)Slovak RepublicSloveniaSmall statesSolomon IslandsSomaliaSouth AfricaSouth AsiaSouth Asia (IDA & IBRD)South SudanSpainSri LankaSt. Kitts and NevisSt. LuciaSt. Martin (French part)St. Vincent and the GrenadinesSub-Saharan Africa Sub-Saharan Africa (excluding high income)Sub-Saharan Africa (IDA & IBRD countries)SudanSurinameSwazilandSwedenSwitzerlandSyrian Arab RepublicTajikistanTanzaniaThailandTimor-LesteTogoTongaTrinidad and TobagoTunisiaTurkeyTurkmenistanUgandaUkraineUnited Arab EmiratesUnited KingdomUnited StatesUpper middle incomeUruguayUzbekistanVanuatuVenezuela, RBVietnamVirgin Islands (U.S.)West Bank and GazaWorldYemen, Rep.ZambiaZimbabwe Timeline:
This timeline shows a graph from 1961 to 2015 of South Asia (IDA & IBRD). No data until 1960. Number of actual observations by date: 55.
Source name:
World Development Indicators
Source organization:
(1) United Nations Population Division. World Population Prospects, (2) Census reports and other statistical publications from national statistical offices, (3) Eurostat: Demographic Statistics, (4) United Nations Statistical Division. Population and Vital Statistics Reprot (various years), (5) U.S. Census Bureau: International Database, and (6) Secretariat of the Pacific Community: Statistics and Demography Programme.
Categories, topics:
Health
Last updated:
apr 23, 2017
Indicators value changes by year
Maximum:
22.184
jan 1, 1961
At the date of observation
Value
Absolute change
Change from previous value
jan 1, 1961
22.184
+22.184
0.0%
jan 1, 1962
21.628
-0.555
-2.5%
jan 1, 1963
21.082
-0.547
-2.53%
jan 1, 1964
20.544
-0.538
-2.55%
jan 1, 1965
20.012
-0.531
-2.59%
jan 1, 1966
19.497
-0.515
-2.58%
jan 1, 1967
19.004
-0.493
-2.53%
jan 1, 1968
18.539
-0.465
-2.45%
jan 1, 1969
18.103
-0.436
-2.35%
jan 1, 1970
17.693
-0.41
-2.27%
jan 1, 1971
17.298
-0.395
-2.23%
jan 1, 1972
16.906
-0.392
-2.27%
jan 1, 1973
16.506
-0.4
-2.37%
jan 1, 1974
16.092
-0.414
-2.51%
jan 1, 1975
15.666
-0.426
-2.65%
jan 1, 1976
15.237
-0.429
-2.74%
jan 1, 1977
14.816
-0.421
-2.76%
jan 1, 1978
14.417
-0.399
-2.69%
jan 1, 1979
14.048
-0.369
-2.56%
jan 1, 1980
13.712
-0.336
-2.39%
jan 1, 1981
13.409
-0.303
-2.21%
jan 1, 1982
13.137
-0.272
-2.03%
jan 1, 1983
12.883
-0.254
-1.93%
jan 1, 1984
12.639
-0.244
-1.89%
jan 1, 1985
12.4
-0.239
-1.89%
jan 1, 1986
12.159
-0.241
-1.95%
jan 1, 1987
11.908
-0.251
-2.06%
jan 1, 1988
11.648
-0.261
-2.19%
jan 1, 1989
11.378
-0.27
-2.32%
jan 1, 1990
11.1
-0.278
-2.44%
jan 1, 1991
10.816
-0.284
-2.55%
jan 1, 1992
10.532
-0.284
-2.63%
jan 1, 1993
10.253
-0.279
-2.65%
jan 1, 1994
9.984
-0.269
-2.62%
jan 1, 1995
9.729
-0.255
-2.55%
jan 1, 1996
9.492
-0.237
-2.44%
jan 1, 1997
9.272
-0.221
-2.32%
jan 1, 1998
9.068
-0.204
-2.2%
jan 1, 1999
8.878
-0.19
-2.09%
jan 1, 2000
8.704
-0.174
-1.96%
jan 1, 2001
8.545
-0.16
-1.83%
jan 1, 2002
8.4
-0.145
-1.7%
jan 1, 2003
8.268
-0.132
-1.57%
jan 1, 2004
8.147
-0.121
-1.46%
jan 1, 2005
8.035
-0.112
-1.37%
jan 1, 2006
7.929
-0.106
-1.32%
jan 1, 2007
7.827
-0.103
-1.3%
jan 1, 2008
7.726
-0.101
-1.29%
jan 1, 2009
7.627
-0.098
-1.27%
jan 1, 2010
7.53
-0.097
-1.27%
jan 1, 2011
7.438
-0.092
-1.22%
jan 1, 2012
7.352
-0.086
-1.16%
jan 1, 2013
7.276
-0.076
-1.03%
jan 1, 2014
7.212
-0.065
-0.89%
jan 1, 2015
7.16
-0.052
-0.72%
Ranking of countries by current statistics by years


Comments: